Microsoft 2002 Annual Report Download - page 51
Download and view the complete annual report
Please find page 51 of the 2002 Microsoft annual report below. You can navigate through the pages in the report by either clicking on the pages listed below, or by using the keyword search tool below to find specific information within the annual report.-
 1
1 -
2
-
3
-
4
-
5
-
6
-
7
-
8
-
9
-
10
-
11
-
12
-
13
-
14
-
15
-
16
-
17
-
18
-
19
-
20
-
21
-
22
-
23
-
24
-
25
-
26
-
27
-
28
-
29
-
30
-
31
-
32
-
33
-
34
-
35
-
36
-
37
-
38
-
39
-
40
-
 41
41 -
 42
42 -
 43
43 -
 44
44 -
 45
45 -
 46
46 -
 47
47 -
 48
48 -
 49
49 -
 50
50 -
 51
51 -
 52
52 -
 53
53 -
 54
54 -
 55
55 -
 56
56 -
 57
57 -
 58
58
 |
 |

MSFT 53 / 2002 FORM 10-K
Part II
Item 8
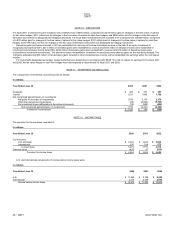
Revenue attributable to U.S. operations includes shipments to customers in the United States, licensing to OEMs and certain multinational organizations,
and exports of finished goods, primarily to Asia, Latin America, and Canada. Revenue from U.S. operations totaled $15.7 billion, $17.8 billion, and $20.9
billion in 2000, 2001, and 2002. Revenue from outside the United States, excluding licensing to OEMs and certain multinational organizations and U.S.
exports, totaled $7.3 billion, $7.5 billion, and $7.5 billion in 2000, 2001, and 2002. No single customer accounted for 10% or more of revenue in 2000, 2001,
or 2002.
Long-lived assets (principally property and equipment) totaled $2.2 billion and $2.0 billion in the United States in 2001 and 2002 and $154 million and
$220 million in other countries in 2001 and 2002.
NOTE 21 SUBSEQUENT EVENT
On July 11, 2002, Microsoft acquired Navision a/s as a result of the successful close of a tender offer. Microsoft purchased Navision’s shares for
approximately $1.45 billion in stock and cash. Navision is a provider of integrated business software solutions for small and medium-sized companies. The
purchase price allocation is currently being developed for this acquisition.
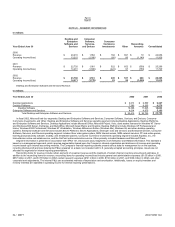
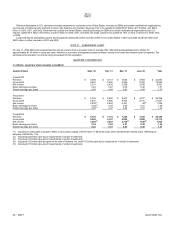
QUARTERLY INFORMATION
In millions, except per share amounts (unaudited)
Quarter Ended Sept. 30 Dec. 31 Mar. 31
June 30
Y
ea
r
Fiscal 2000
Revenue $5,384 $6,112 $5,656 $ 5,804 $22,956
Gross profit 4,672 5,356 4,904 5,022 19,954
Net income 2,191 2,436 2,385 2,409 9,421
Basic earnings per share 0.43 0.47 0.46 0.46 1.81
Diluted earnings per share 0.40 0.44 0.43 0.44 1.70
Fiscal 2001
Revenue $5,766 $6,550 $6,403 $ 6,577 $25,296
Gross profit 4,941 5,686 5,504 5,710 21,841
Net income 2,206
(1)
2,624 2,451 65
(2)
7,346
Basic earnings per share 0.42
(1)
0.49 0.46 0.01 1.38
Diluted earnings per share 0.40
(1)
0.47 0.44 0.01 1.32
Fiscal 2002
Revenue $6,126 $7,741 $7,245 $ 7,253 $28,365
Gross profit 5,242 6,197 5,850 5,885 23,174
Net income 1,283
(3)
2,283 2,738
(4)
1,525
(5)
7,829
Basic earnings per share 0.24 0.42 0.51 0.28 1.45
Diluted earnings per share 0.23 0.41 0.49 0.28 1.41
(1) Includes an unfavorable cumulative effect of accounting change of $375 million or $0.07 per basic share and $0.06 per diluted share, reflecting the
adoption of SFAS No. 133.
(2) Includes $3.92 billion (pre-tax) in impairments of certain investments.
(3) Includes $1.82 billion (pre-tax) in impairments of certain investments.
(4) Includes $1.25 billion (pre-tax) gain on the sale of Expedia, Inc. and $1.19 billion (pre-tax) in impairments of certain investments.
(5) Includes $1.19 billion (pre-tax) in impairments of certain investments.