Microsoft 2002 Annual Report Download - page 50
Download and view the complete annual report
Please find page 50 of the 2002 Microsoft annual report below. You can navigate through the pages in the report by either clicking on the pages listed below, or by using the keyword search tool below to find specific information within the annual report.-
 1
1 -
2
-
3
-
4
-
5
-
6
-
7
-
8
-
9
-
10
-
11
-
12
-
13
-
14
-
15
-
16
-
17
-
18
-
19
-
20
-
21
-
22
-
23
-
24
-
25
-
26
-
27
-
28
-
29
-
30
-
31
-
32
-
33
-
34
-
35
-
36
-
37
-
38
-
39
-
 40
40 -
 41
41 -
 42
42 -
 43
43 -
 44
44 -
 45
45 -
 46
46 -
 47
47 -
 48
48 -
 49
49 -
 50
50 -
 51
51 -
 52
52 -
 53
53 -
 54
54 -
 55
55 -
 56
56 -
 57
57 -
 58
58
 |
 |

MSFT 52 / 2002 FORM 10-K
Part II
Item 8
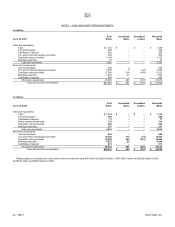
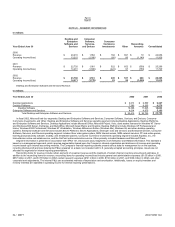
NOTE 20 SEGMENT INFORMATION
In millions
Year Ended June 30
Desktop and
Enterprise
Software and
Services
Consume
r
Software,
Services,
and Devices
Consume
r
Commerce
Investments Othe
r
Reconciling
Amounts Consolidated
2000
Revenue $ 20,410 $1,654 $182 $691
$ 19 $22,956
Operating income/(loss) 13,210 (1,090) (60) 86
(1,140) 11,006
2001
Revenue $ 22,720 $1,961 $522 $652
$ (559) $25,296
Operating income/(loss) 14,261 (1,666) (222) 97
(750) 11,720
2002
Revenue $ 23,786 $3,531 $245 $537
$ 266 $28,365
Operating income/(loss) 14,671 (1,778) 23 59
(1,065) 11,910
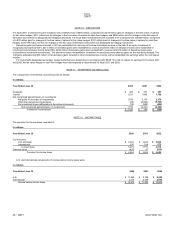
Desktop and Enterprise Software and Services Revenue:
In millions
Y
ear Ended June 30 2000 2001 2002
Desktop Applications $ 9,013 $ 9,580 $9,327
Desktop Platforms 7,383 8,265 9,276
Desktop Software 16,396 17,845 18,603
Enterprise Software and Services 4,014 4,875 5,183
Total Desktop and Enterprise Software and Services $ 20,410 $ 22,720 $23,786
In fiscal 2002, Microsoft had four segments: Desktop and Enterprise Software and Services; Consumer Software, Services, and Devices; Consumer
Commerce Investments; and Other. Desktop and Enterprise Software and Services operating segment includes Desktop Applications, Desktop Platforms,
and Enterprise Software and Services. Desktop Applications include Microsoft Office; Microsoft Project; Visio; client access licenses for Windows NT Server
and Windows 2000 Server, Exchange, and BackOffice; Microsoft Great Plains; and bCentral. Desktop Platforms include Windows XP Professional and
Home, Windows 2000 Professional, Windows NT Workstation, Windows Millennium Edition (Windows Me), Windows 98, and other desktop operating
systems. Enterprise Software and Services includes Server Platforms; Server Applications; developer tools and services; and Enterprise services. Consumer
Software, Services, and Devices operating segment includes Xbox video game system, MSN Internet access, MSN network services, PC and online games,
learning and productivity software, mobility, and embedded systems. Consumer Commerce Investments operating segment includes Expedia, Inc., the
HomeAdvisor online real estate service, and the CarPoint online automotive service. Other primarily includes Hardware and Microsoft Press.
Segment information is presented in accordance with SFAS 131, Disclosures about Segments of an Enterprise and Related Information. This standard is
based on a management approach, which requires segmentation based upon the Company’s internal organization and disclosure of revenue and operating
income based upon internal accounting methods. The Company’s financial reporting systems present various data for management to run the business,
including internal profit and loss statements (P&Ls) prepared on a basis not consistent with U.S. generally accepted accounting principles. Assets are not
allocated to segments for internal reporting presentations.
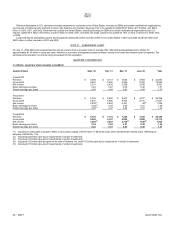
Reconciling items for revenue include certain elements of unearned revenue and the treatment of certain channel inventory amounts and estimates. In
addition to the reconciling items for revenue, reconciling items for operating income/(loss) include general and administrative expenses ($1.05 billion in 2000,
$857 million in 2001, and $1.55 billion in 2002), certain research expenses ($141 million in 2000, $154 million in 2001, and $166 million in 2002), and other
corporate level adjustments. The internal P&Ls use accelerated methods of depreciation and amortization. Additionally, losses on equity investees and
minority interests are classified in operating income for internal reporting presentations.