Microsoft 2002 Annual Report Download - page 25
Download and view the complete annual report
Please find page 25 of the 2002 Microsoft annual report below. You can navigate through the pages in the report by either clicking on the pages listed below, or by using the keyword search tool below to find specific information within the annual report.-
 1
1 -
2
-
3
-
4
-
5
-
6
-
7
-
8
-
9
-
10
-
11
-
12
-
13
-
14
-
 15
15 -
 16
16 -
 17
17 -
 18
18 -
 19
19 -
 20
20 -
 21
21 -
 22
22 -
 23
23 -
 24
24 -
 25
25 -
 26
26 -
 27
27 -
 28
28 -
 29
29 -
 30
30 -
 31
31 -
 32
32 -
 33
33 -
 34
34 -
 35
35 -
36
-
37
-
38
-
39
-
40
-
41
-
42
-
43
-
44
-
45
-
46
-
47
-
48
-
49
-
50
-
51
-
52
-
53
-
54
-
55
-
56
-
57
-
58
 |
 |

MSFT 27 / 2002 FORM 10-K
Part II
Item 7
ITEM 7. MANAGEMENT’S DISCUSSION AND ANALYSIS
OF RESULTS OF OPERATIONS AND FINANCIAL CONDITION
RESULTS OF OPERATIONS FOR 2000, 2001, AND 2002
Management’s Discussion and Analysis contains statements that are forward-looking. These statements are based on current expectations and assumptions
that are subject to risks and uncertainties. Actual results could differ materially because of factors discussed in “Issues and Uncertainties.”
REVENUE
The Company’s revenue growth rate was 16% in fiscal 2000, 10% in fiscal 2001, and 12% in fiscal 2002. Revenue growth in fiscal 2002 was led by the
addition of Xbox video game system revenue and the strong penetration of Microsoft Windows XP Professional and Home operating systems. Revenue
growth in fiscal 2001 was driven primarily by licensing of Microsoft Windows 2000 Professional, Microsoft SQL Server, and the other .NET Enterprise
Servers. Revenue growth in fiscal 2000 was driven by strong licensing of Microsoft Windows NT Workstation, Windows 2000 Professional, Windows NT
Server, Windows 2000 Server, Microsoft Office 2000, and SQL Server.
Microsoft continued to see a mix shift to volume licensing programs. On October 1, 2001, Microsoft launched Licensing 6.0 to simplify and improve its
volume licensing programs, including a simplified approach to software upgrades. One feature of Licensing 6.0 is Software Assurance which gives customers
the right to install any new release of products covered in the licensing agreement during the term of their coverage. The success of Microsoft’s new volume
licensing programs will continue to affect the mix of multi-year licensing agreements with a resulting impact on the timing of revenue recognition. In addition,
the timing and extent of a recovery in consumer and corporate spending on PCs and information technology (IT) will be factors affecting revenue growth.
PRODUCT REVENUE
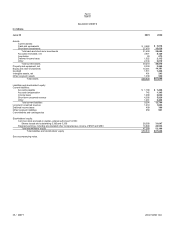
In fiscal 2002, Microsoft had four segments: Desktop and Enterprise Software and Services; Consumer Software, Services, and Devices; Consumer
Commerce Investments; and Other. The revenue figures in this Management’s Discussion and Analysis (MD&A) differ from those reported in the Company’s
Segment Information appearing in Note 20 of the Notes to Financial Statements. The revenue figures in the Segment Information represent amounts reported
internally for management reporting, while the revenue figures in the MD&A reflect revenue recognized in accordance with generally accepted accounting
principles. On July 1, 2002, Microsoft revised its product segments and will begin reporting the new segments in fiscal 2003.
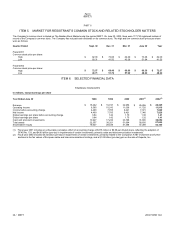
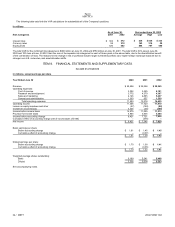
Desktop and Enterprise Software and Services. Desktop and Enterprise Software and Services revenue was $20.40 billion, $22.41 billion, and $24.01
billion in 2000, 2001, and 2002. Desktop and Enterprise Software and Services includes Desktop Applications; Desktop Platforms; and Enterprise Software
and Services.
Desktop Applications revenue was $9.30 billion, $9.54 billion, and $9.60 billion in 2000, 2001, and 2002. Desktop Applications includes revenue from
Microsoft Office; Microsoft Project; Visio; client access licenses (CALs) for Windows NT Server and Windows 2000 Server, Exchange, and BackOffice;
Microsoft Great Plains; and bCentral. In fiscal 2002, Office licensing revenue declined during the year due to a strong mix shift to multi-year annuity licensing
agreements, which deferred revenue recognition to future years, and a decrease in consumer purchases in the Asia region, most notably Japan, partially
offset by strong OEM licensing. Revenue from client access licenses grew 3% in fiscal 2002 and revenue from Great Plains contributed to the growth in
Desktop Applications. In fiscal 2001, revenue from client access licenses increased 14% reflecting strong licensing growth of Windows NT Server and
Windows 2000 Server CALs. Office revenue growth was flat during fiscal 2001. In fiscal 2000, revenue growth from Microsoft Office integrated suites,
including the Premium, Professional, Small Business, and Standard Editions was very solid.
Desktop Platforms revenue was $7.02 billion, $8.04 billion, and $9.30 billion in 2000, 2001, and 2002. Desktop Platforms includes revenue from Windows
XP Professional and Home, Windows 2000 Professional, Windows NT Workstation, Windows Me, Windows 98, and other desktop operating systems. In
fiscal 2002, the growth in Desktop Platforms revenue reflected strong multi-year licensing revenue growth and a continued mix shift to the higher priced
Windows 2000 and Windows XP Professional operating system through OEMs, despite a decline in reported OEM unit shipments. Fiscal 2001 revenue
growth reflected the strong adoption of Windows 2000 Professional, partially offset by flat revenue growth from Windows Me and Windows 98 operating
systems, reflecting the slowdown in consumer PC shipments and a higher mix of Windows 2000 Professional and Windows NT Workstation. In fiscal 2000,
Desktop Platforms revenue growth was modest due to soft demand for business PCs during most of the year; a slowdown in shipments in anticipation of the
post mid-year availability of Windows 2000 operating systems; and, as expected, a longer business migration cycle for the newest Windows operating system
offerings. The rate of growth in PC shipments and the mix of Windows 2000 and Windows XP Professional as a percentage of all 32-bit operating systems
will continue to impact revenue growth in the future.
Enterprise Software and Services revenue was $4.08 billion, $4.83 billion, and $5.11 billion in 2000, 2001, and 2002. Enterprise Software and Services
includes Server Platforms, Server Applications, Developer Tools and Services, and Enterprise Services. In fiscal 2002, Server Applications, including
Microsoft SQL Server and .NET Enterprise Servers, increased 10% compared to fiscal 2001. Server Platform revenue, which includes Windows 2000 Server
and Windows NT Server operating systems, increased 10% versus fiscal 2001 driven by a modest overall increase in Windows-based server shipments and
increased deployment of Windows 2000 Server. Enterprise Services revenue, representing consulting and product support services, was up 17% compared
to fiscal 2001, while revenue from Developer Tools and Services was down 19% from fiscal 2001. In fiscal 2001, Server Applications revenue increased 31%
versus the prior year as a result of