Microsoft 2002 Annual Report Download - page 32
Download and view the complete annual report
Please find page 32 of the 2002 Microsoft annual report below. You can navigate through the pages in the report by either clicking on the pages listed below, or by using the keyword search tool below to find specific information within the annual report.-
 1
1 -
2
-
3
-
4
-
5
-
6
-
7
-
8
-
9
-
10
-
11
-
12
-
13
-
14
-
15
-
16
-
17
-
18
-
19
-
20
-
21
-
 22
22 -
 23
23 -
 24
24 -
 25
25 -
 26
26 -
 27
27 -
 28
28 -
 29
29 -
 30
30 -
 31
31 -
 32
32 -
 33
33 -
 34
34 -
 35
35 -
 36
36 -
 37
37 -
 38
38 -
 39
39 -
 40
40 -
 41
41 -
 42
42 -
43
-
44
-
45
-
46
-
47
-
48
-
49
-
50
-
51
-
52
-
53
-
54
-
55
-
56
-
57
-
58
 |
 |

MSFT 34 / 2002 FORM 10-K
Part II
Item 7A, 8
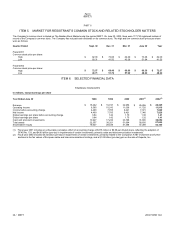
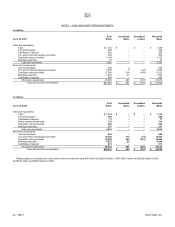
The following table sets forth the VAR calculations for substantially all of the Company’s positions:
In millions
A
so
f
June 30,
Y
ear ended June 30, 2002
Risk Categories 2001 2002 Average High Low
Interest rates $363 $472 $ 435 $535 $333
Currency rates 58 310 162 310 58
Equity prices 520 602 584 757 488
The total VAR for the combined risk categories is $908 million at June 30, 2002 and $759 million at June 30, 2001. The total VAR is 34% less at June 30,
2002 and 19% less at June, 30 2001 than the sum of the separate risk categories for each of those years in the above table, due to the diversification benefit
of the combination of risks. The reasons for the change in risk in portfolios include: larger investment portfolio size, higher foreign exchange exposure due to
stronger non-U.S. currencies, and asset allocation shifts.
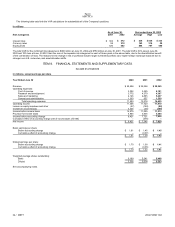
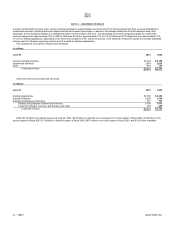
ITEM 8. FINANCIAL STATEMENTS AND SUPPLEMENTARY DATA
INCOME STATEMENTS
In millions, except earnings per share
Y
ear Ended June 30 2000 2001 2002
Revenue $ 22,956
$ 25,296 $28,365
Operating expenses:
Cost of revenue 3,002
3,455 5,191
Research and development 3,772
4,379 4,307
Sales and marketing 4,126
4,885 5,407
General and administrative 1,050
857 1,550
Total operating expenses 11,950
13,576 16,455
Operating income 11,006
11,720 11,910
Losses on equity investees and other (57)
(159) (92)
Investment income/(loss) 3,326
(36) (305)
Income before income taxes 14,275
11,525 11,513
Provision for income taxes 4,854
3,804 3,684
Income before accounting change 9,421
7,721 7,829
Cumulative effect of accounting change (net of income taxes of $185)
–
(375)
–
Net income $ 9,421
$ 7,346 $7,829
Basic earnings per share:
Before accounting change $ 1.81
$ 1.45 $1.45
Cumulative effect of accounting change
–
(0.07)
–
$ 1.81
$ 1.38 $1.45
Diluted earnings per share:
Before accounting change $ 1.70
$ 1.38 $1.41
Cumulative effect of accounting change
–
(0.06)
–
$ 1.70
$ 1.32 $1.41
Weighted average shares outstanding:
Basic 5,189
5,341 5,406
Diluted 5,536
5,574 5,553
See accompanying notes.