Microsoft 2002 Annual Report Download - page 24
Download and view the complete annual report
Please find page 24 of the 2002 Microsoft annual report below. You can navigate through the pages in the report by either clicking on the pages listed below, or by using the keyword search tool below to find specific information within the annual report.-
 1
1 -
2
-
3
-
4
-
5
-
6
-
7
-
8
-
9
-
10
-
11
-
12
-
13
-
 14
14 -
 15
15 -
 16
16 -
 17
17 -
 18
18 -
 19
19 -
 20
20 -
 21
21 -
 22
22 -
 23
23 -
 24
24 -
 25
25 -
 26
26 -
 27
27 -
 28
28 -
 29
29 -
 30
30 -
 31
31 -
 32
32 -
 33
33 -
 34
34 -
35
-
36
-
37
-
38
-
39
-
40
-
41
-
42
-
43
-
44
-
45
-
46
-
47
-
48
-
49
-
50
-
51
-
52
-
53
-
54
-
55
-
56
-
57
-
58
 |
 |

MSFT 26 / 2002 FORM 10-K
Part II
Item 5, 6
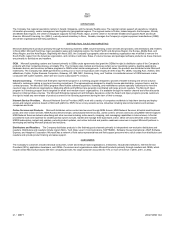
PART II
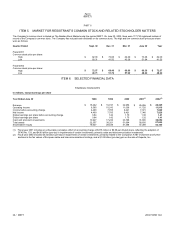
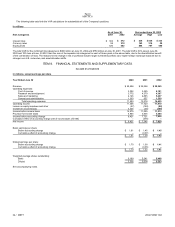
ITEM 5. MARKET FOR REGISTRANT’S COMMON STOCK AND RELATED STOCKHOLDER MATTERS
The Company’s common stock is traded on The Nasdaq Stock Market under the symbol MSFT. On June 30, 2002, there were 117,730 registered holders of
record of the Company’s common stock. The Company has not paid cash dividends on its common stock. The high and low common stock prices per share
were as follows:
Quarter Ended Sept. 30 Dec. 31 Mar. 31 June 30
Y
ea
r
Fiscal 2001
Common stock price per share:
High $82.00 $70.88 $64.69 $ 73.68 $82.00
Low 60.31 41.50 43.38 51.94 41.50
Fiscal 2002
Common stock price per share:
High $72.57 $69.49 $69.86 $ 60.38 $72.57
Low 49.71 51.79 57.99 48.62 48.62
ITEM 6. SELECTED FINANCIAL DATA
FINANCIAL HIGHLIGHTS
In millions, except earnings per share
Y
ear Ended June 30 1998 1999 2000 2001
(1)
2002
(2)
Revenue $15,262 $19,747 $22,956 $ 25,296 $28,365
Operating income 6,585 10,010 11,006 11,720 11,910
Income before accounting change 4,490 7,785 9,421 7,721 7,829
Net income 4,490 7,785 9,421 7,346 7,829
Diluted earnings per share before accounting change 0.84 1.42 1.70 1.38 1.41
Diluted earnings per share 0.84 1.42 1.70 1.32 1.41
Cash and short-term investments 13,927 17,236 23,798 31,600 38,652
Total assets 22,357 38,321 51,694 58,830 67,646
Stockholders’ equity 16,627 28,438 41,368 47,289 52,180
(1) Fiscal year 2001 includes an unfavorable cumulative effect of accounting change of $375 million or $0.06 per diluted share, reflecting the adoption of
SFAS No. 133, and $4.80 billion (pre-tax) in impairments of certain investments, primarily cable and telecommunication investments.
(2) Fiscal year 2002 includes $4.32 billion (pre-tax) in impairments of certain investments, primarily related to the Company’s AT&T investment and further
declines in the fair values of European cable and telecommunications holdings, and a $1.25 billion (pre-tax) gain on the sale of Expedia, Inc.