Lumber Liquidators 2012 Annual Report Download - page 62
Download and view the complete annual report
Please find page 62 of the 2012 Lumber Liquidators annual report below. You can navigate through the pages in the report by either clicking on the pages listed below, or by using the keyword search tool below to find specific information within the annual report.-
 1
1 -
2
-
3
-
4
-
5
-
6
-
7
-
8
-
9
-
10
-
11
-
12
-
13
-
14
-
15
-
16
-
17
-
18
-
19
-
20
-
21
-
22
-
23
-
24
-
25
-
26
-
27
-
28
-
29
-
30
-
31
-
32
-
33
-
34
-
35
-
36
-
37
-
38
-
39
-
40
-
41
-
42
-
43
-
44
-
45
-
46
-
47
-
48
-
49
-
50
-
51
-
 52
52 -
 53
53 -
 54
54 -
 55
55 -
 56
56 -
 57
57 -
 58
58 -
 59
59 -
 60
60 -
 61
61 -
 62
62 -
 63
63 -
 64
64 -
 65
65 -
 66
66 -
 67
67 -
 68
68 -
 69
69 -
 70
70 -
 71
71 -
 72
72
 |
 |

Lumber Liquidators Holdings, Inc.
Notes to Consolidated Financial Statements—(Continued)
(amounts in thousands, except share data and per share amounts)
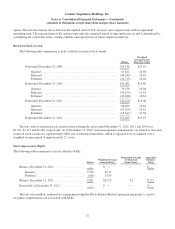
NOTE 13. CONDENSED QUARTERLY FINANCIAL INFORMATION (unaudited)
The following tables present the Company’s unaudited quarterly results for 2012 and 2011.
Quarter Ended
March 31,
2012
June 30,
2012
September 30,
2012
December 31,
2012
(dollars in thousands, except per share amounts)
Net Sales ................................................... $188,034 $210,347 $204,291 $210,655
Gross Profit ................................................ 70,137 78,480 77,886 82,282
Selling, General and Administrative Expenses ..................... 56,819 58,685 57,135 57,800
Operating Income ............................................ 13,318 19,795 20,751 24,482
Net Income ................................................. $ 8,197 $ 12,177 $ 12,882 $ 13,808(1)
Net Income per Common Share – Basic .......................... $ 0.29 $ 0.44 $ 0.47 $ 0.51
Net Income per Common Share – Diluted ......................... $ 0.29 $ 0.43 $ 0.46 $ 0.50
Number of Stores Opened in Quarter ............................. 4 10 7 4
Comparable Store Net Sales Increase ............................ 7.5% 12.4% 12.0% 13.2%
Effective Tax Rate ........................................... 38.6% 38.6% 38.0% 43.7%
(1) Net income included $1,267 of income tax expense related to the recording of a full valuation allowance on the net
deferred tax assets in Canada in the quarter ended December 31, 2012.
Quarter Ended
March 31,
2011
June 30,
2011
September 30,
2011
December 31,
2011
(dollars in thousands, except per share amounts)
Net Sales ................................................... $159,680 $175,460 $171,993 $174,454
Gross Profit ................................................ 57,793 59,724 61,248 61,910
Selling, General and Administrative Expenses ..................... 48,453 51,051 50,327 48,405
Operating Income ............................................ 9,340 8,673 10,921 13,505
Net Income ................................................. $ 5,777 $ 5,287 $ 6,735 $ 8,458
Net Income per Common Share – Basic .......................... $ 0.21 $ 0.19 $ 0.24 $ 0.30
Net Income per Common Share – Diluted ......................... $ 0.20 $ 0.19 $ 0.24 $ 0.30
Number of Stores Opened in Quarter ............................. 16 11 6 7
Comparable Store Net Sales Increase (Decrease) ................... (4.3%) (7.9%) 3.0% 1.9%
Effective Tax Rate ........................................... 38.7% 39.5% 39.2% 38.7%
56