Lumber Liquidators 2012 Annual Report Download - page 34
Download and view the complete annual report
Please find page 34 of the 2012 Lumber Liquidators annual report below. You can navigate through the pages in the report by either clicking on the pages listed below, or by using the keyword search tool below to find specific information within the annual report.-
 1
1 -
2
-
3
-
4
-
5
-
6
-
7
-
8
-
9
-
10
-
11
-
12
-
13
-
14
-
15
-
16
-
17
-
18
-
19
-
20
-
21
-
22
-
23
-
 24
24 -
 25
25 -
 26
26 -
 27
27 -
 28
28 -
 29
29 -
 30
30 -
 31
31 -
 32
32 -
 33
33 -
 34
34 -
 35
35 -
 36
36 -
 37
37 -
 38
38 -
 39
39 -
 40
40 -
 41
41 -
 42
42 -
 43
43 -
 44
44 -
45
-
46
-
47
-
48
-
49
-
50
-
51
-
52
-
53
-
54
-
55
-
56
-
57
-
58
-
59
-
60
-
61
-
62
-
63
-
64
-
65
-
66
-
67
-
68
-
69
-
70
-
71
-
72
 |
 |

Net sales for 2012 increased $131.7 million, or 19.3%, over 2011 as net sales in comparable stores increased $77.2
million and net sales in non-comparable stores increased $54.5 million. Net sales for 2011 increased $61.3 million, or 9.9%,
over 2010 due to an increase of $73.8 million in non-comparable store net sales which was offset by a $12.5 million decrease
in comparable store net sales.
Net sales in comparable stores increased 11.4% comparing 2012 to 2011 driven by an 8.6% increase in the number of
customers invoiced and a 2.5% increase in the average sale. Comparing 2011 to 2010, the 2.0% decrease in net sales at
comparable stores resulted from a 4.7% decrease in the number of customers invoiced, offset by a 2.8% increase in the
average sale.
The average sale over the past two years has benefited from an increase in the average retail price per unit sold. In
comparing 2012 to 2011, the average sale also benefited from an increase in the volume of units sold, reversing a decrease in
comparing 2011 to 2010. Key drivers of retail price and volume include:
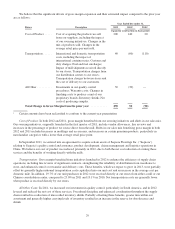
• The sales mix of moldings and accessories, which increased to 16.3% of total net sales in 2012 from 14.6% in 2011
and 13.7% in 2010. Moldings and accessories generally increase both the volume of units sold and the average
retail price per unit sold.
• Changes in the sales mix of flooring products and the total square footage of the project. In both 2012 and 2011,
customer preference for premium products increased, particularly within certain product categories including
laminates, engineered hardwood, bamboo, cork and resilient.
The number of customers invoiced in comparable stores has benefited from:
• Greater recognition of our value proposition due to our efforts to expand our advertising reach and frequency,
which we began in the fourth quarter of 2011.
• Fewer non-comparable stores operating in existing markets. At December 31, 2012, we were operating 18 non-
comparable stores in markets which included at least one comparable store, down from 24 stores at December 31,
2011 and 23 stores at December 31, 2010.
• A greater number of stores in operation for 13 to 36 months, or the first two years as a comparable store, when
increases in net sales are generally higher than average due primarily to greater brand awareness in the market.
In 2011, particularly in the first half of the year, we believe the number of customers invoiced decreased in comparison
to 2010 due to our reduced productivity in serving customer demand and greater consumer caution with regard to large-
ticket, discretionary purchases.
New store locations continue to positively impact our net sales growth. We opened 25 new locations in 2012, with
approximately two-thirds of these locations in existing markets. In 2011, we opened 40 new locations in an equal split of new
and existing markets. Due to the opening schedule of new store locations over the previous 24 months, the average non-
comparable store operating in 2011 was more mature, as measured in months of operation, than the average non-comparable
store operating in 2012, which approximated our historical average. In Canada, we had nine stores operating at December 31,
2012, up from seven at December 31, 2011.
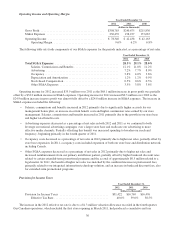
Gross Profit and Gross Margin
Year Ended December 31,
2012 2011 2010
(dollars in thousands)
Net Sales ..................................... $813,327 $681,587 $620,281
Cost of Sales .................................. 504,542 440,912 404,451
Gross Profit ................................... $308,785 $240,675 $215,830
Gross Margin .............................. 38.0% 35.3% 34.8%
28