Lumber Liquidators 2012 Annual Report Download - page 58
Download and view the complete annual report
Please find page 58 of the 2012 Lumber Liquidators annual report below. You can navigate through the pages in the report by either clicking on the pages listed below, or by using the keyword search tool below to find specific information within the annual report.-
 1
1 -
2
-
3
-
4
-
5
-
6
-
7
-
8
-
9
-
10
-
11
-
12
-
13
-
14
-
15
-
16
-
17
-
18
-
19
-
20
-
21
-
22
-
23
-
24
-
25
-
26
-
27
-
28
-
29
-
30
-
31
-
32
-
33
-
34
-
35
-
36
-
37
-
38
-
39
-
40
-
41
-
42
-
43
-
44
-
45
-
46
-
47
-
 48
48 -
 49
49 -
 50
50 -
 51
51 -
 52
52 -
 53
53 -
 54
54 -
 55
55 -
 56
56 -
 57
57 -
 58
58 -
 59
59 -
 60
60 -
 61
61 -
 62
62 -
 63
63 -
 64
64 -
 65
65 -
 66
66 -
 67
67 -
 68
68 -
69
-
70
-
71
-
72
 |
 |

Lumber Liquidators Holdings, Inc.
Notes to Consolidated Financial Statements—(Continued)
(amounts in thousands, except share data and per share amounts)
option. The risk-free interest rate is based on the implied yield of U.S. Treasury zero-coupon issues with an equivalent
remaining term. The expected term of the options represents the estimated period of time until exercise and is determined by
considering the contractual terms, vesting schedule and expectations of future employee behavior.
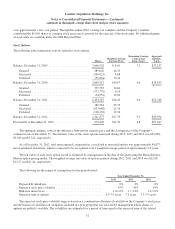
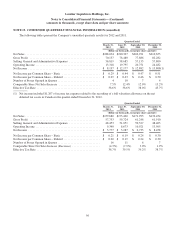
Restricted Stock Awards
The following table summarizes activity related to restricted stock awards:
Shares
Weighted
Average Grant
Date Fair Value
Nonvested, December 31, 2009 .................................... 145,230 $12.19
Granted .................................................. 67,811 24.69
Released .................................................. (48,245) 24.63
Forfeited .................................................. (22,715) 14.26
Nonvested, December 31, 2010 .................................... 142,081 $13.60
Granted .................................................. 79,236 23.28
Released .................................................. (56,529) 21.45
Forfeited .................................................. (22,668) 18.61
Nonvested, December 31, 2011 .................................... 142,120 $15.08
Granted .................................................. 66,425 27.62
Released .................................................. (43,529) 29.41
Forfeited .................................................. (12,611) 21.58
Nonvested, December 31, 2012 .................................... 152,405 $15.19
The fair value of restricted stock awards released during the years ended December 31, 2012, 2011 and 2010 was
$1,391, $1,212 and $1,188, respectively. As of December 31, 2012, total unrecognized compensation cost related to unvested
restricted stock awards was approximately $856, net of estimated forfeitures, which is expected to be recognized over a
weighted average period of approximately 2.1 years.
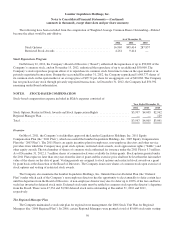
Stock Appreciation Rights
The following table summarizes activity related to SARs:
Shares
Weighted Average
Exercise Price
Remaining Average
Contractual
Term (Years)
Aggregate
Intrinsic
Value
Balance, December 31, 2011 ................... — $ — — $—
Granted ................................ 9,796 24.71
Forfeited ............................... (165) 24.35
Balance, December 31, 2012 ................... 9,631 $24.72 9.2 $ 271
Exercisable at December 31, 2012 ............... — $ — — $—
The fair value method, estimated by management using the Black-Scholes-Merton option pricing model, is used to
recognize compensation cost associated with SARs.
52