Lumber Liquidators 2012 Annual Report Download - page 48
Download and view the complete annual report
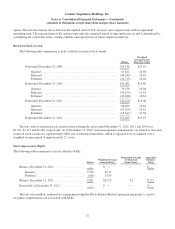
Please find page 48 of the 2012 Lumber Liquidators annual report below. You can navigate through the pages in the report by either clicking on the pages listed below, or by using the keyword search tool below to find specific information within the annual report.
Lumber Liquidators Holdings, Inc.
Consolidated Statements of Stockholders’ Equity
(in thousands, except share data)
Common Stock Treasury Stock
Shares
Par
Value Shares Value
Additional
Capital
Retained
Earnings
Accumulated
Other
Comprehensive
Income (Loss)
Total
Stockholders’
Equity
Balance, December 31, 2009 ................... 27,234,222 $ 27 29,842 $ (478) $ 95,204 $ 53,681 $ — $148,434
Stock-Based Compensation Expense ......... — — — — 3,091 — — 3,091
Exercise of Stock Options .................. 206,821 — — — 1,796 — — 1,796
Excess Tax Benefits on Stock Option
Exercises ............................. — — — — 1,307 — — 1,307
Release of Restricted Stock ................. 48,084 — — — — — — —
Common Stock Repurchased ................ (16,447) — 16,447 (389) — — — (389)
Net Income .............................. — — — — — 26,266 — 26,266
Balance, December 31, 2010 ................... 27,472,680 $ 27 46,289 $ (867) $101,398 $ 79,947 $ — $180,505
Stock-Based Compensation Expense ......... — — — — 4,005 — — 4,005
Exercise of Stock Options .................. 377,775 1 — — 3,070 — — 3,071
Excess Tax Benefits on Stock Option
Exercises ............................. — — — — 1,690 — — 1,690
Release of Restricted Stock ................. 56,529 — — — — — — —
Common Stock Repurchased ................ (12,441) — 12,441 (249) — — — (249)
Translation Adjustment .................... — — — — — — (194) (194)
Net Income .............................. — — — — — 26,256 — 26,256
Balance, December 31, 2011 ................... 27,894,543 $ 28 58,730 $ (1,116) $110,163 $106,203 $(194) $215,084
Stock-Based Compensation Expense ......... — — — — 3,977 — — 3,977
Exercise of Stock Options .................. 937,048 1 — — 10,453 — — 10,454
Excess Tax Benefits on Stock Option
Exercises ............................. — — — — 7,131 — — 7,131
Release of Restricted Stock ................. 43,529 — — — — — — —
Common Stock Repurchased ................ (1,660,976) — 1,660,976 (49,436) — — — (49,436)
Translation Adjustment .................... — — — — — — 267 267
Net Income .............................. — — — — — 47,064 — 47,064
Balance, December 31, 2012 ................... 27,214,144 $ 29 1,719,706 $(50,552) $131,724 $153,267 $ 73 $234,541
See accompanying notes to consolidated financial statements
42


