Lumber Liquidators 2012 Annual Report Download - page 36
Download and view the complete annual report
Please find page 36 of the 2012 Lumber Liquidators annual report below. You can navigate through the pages in the report by either clicking on the pages listed below, or by using the keyword search tool below to find specific information within the annual report.-
 1
1 -
2
-
3
-
4
-
5
-
6
-
7
-
8
-
9
-
10
-
11
-
12
-
13
-
14
-
15
-
16
-
17
-
18
-
19
-
20
-
21
-
22
-
23
-
24
-
25
-
 26
26 -
 27
27 -
 28
28 -
 29
29 -
 30
30 -
 31
31 -
 32
32 -
 33
33 -
 34
34 -
 35
35 -
 36
36 -
 37
37 -
 38
38 -
 39
39 -
 40
40 -
 41
41 -
 42
42 -
 43
43 -
 44
44 -
 45
45 -
 46
46 -
47
-
48
-
49
-
50
-
51
-
52
-
53
-
54
-
55
-
56
-
57
-
58
-
59
-
60
-
61
-
62
-
63
-
64
-
65
-
66
-
67
-
68
-
69
-
70
-
71
-
72
 |
 |

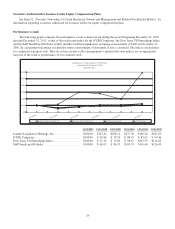
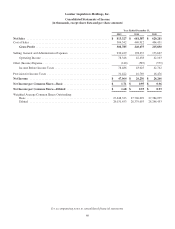
Operating Income and Operating Margin
Year Ended December 31,
2012 2011 2010
(dollars in thousands)
Gross Profit ........................................... $308,785 $240,675 $215,830
SG&A Expenses ....................................... 230,439 198,237 173,667
Operating Income ...................................... $ 78,346 $ 42,438 $ 42,163
Operating Margin .................................. 9.6% 6.2% 6.8%
The following table sets forth components of our SG&A expenses for the periods indicated, as a percentage of net sales.
Year Ended December 31,
2012 2011 2010
Total SG&A Expenses ........................................... 28.3% 29.1% 28.0%
Salaries, Commissions and Benefits .............................. 12.1% 11.8% 11.2%
Advertising ................................................. 7.2% 7.7% 8.0%
Occupancy .................................................. 3.8% 4.0% 3.6%
Depreciation and Amortization .................................. 1.2% 1.2% 0.9%
Stock-based Compensation ..................................... 0.5% 0.6% 0.5%
Other SG&A Expenses ........................................ 3.5% 3.8% 3.8%
Operating income for 2012 increased $35.9 million over 2011 as the $68.1 million increase in gross profit was partially
offset by a $32.2 million increase in SG&A expenses. Operating income for 2011 increased $0.3 million over 2010 as the
$24.9 million increase in gross profit was almost fully offset by a $24.6 million increase in SG&A expenses. The increase in
SG&A expenses included the following:
• Salaries, commissions and benefits increased in 2012 primarily due to significantly higher accruals for our
management bonus plan, an increase in certain benefit costs and higher commission rates earned by our store
management. Salaries, commissions and benefits increased in 2011 primarily due to the growth in our store base
and higher total benefit costs.
• Advertising expenses decreased as a percentage of net sales in both 2012 and 2011 as we continued to both
leverage our national advertising campaigns over a larger store base and reallocate our advertising to more
effective media channels. Partially offsetting this benefit was increased spending to broaden our reach and
frequency, beginning primarily in the fourth quarter of 2011.
• Occupancy costs decreased as a percentage of net sales in 2012 primarily due to higher net sales, partially offset by
store base expansion. In 2011, occupancy costs included expansion of both our store base and distribution network,
including Canada.
• Other SG&A expenses decreased as a percentage of net sales in 2012 primarily due to higher net sales and
increased reimbursements from our primary installation partner, partially offset by higher bankcard discount rates
related to certain extended-term promotional programs and the accrual of approximately $0.5 million related to a
legal matter. In 2011, the benefit of higher net sales was matched by the combined increase in professional fees,
primarily related to our integrated information technology solution, and an increase in bankcard discount fees, also
for extended-term promotional programs.
Provision for Income Taxes
Year Ended December 31,
2012 2011 2010
(dollars in thousands)
Provision for Income Taxes ................................. $31,422 $16,769 $16,476
Effective Tax Rate ..................................... 40.0% 39.0% 38.5%
The increase in the 2012 effective tax rate is due to a $1.3 million valuation allowance recorded in the fourth quarter.
Our Canadian operations, which included the first stores opening in March 2011, had produced a cumulative net loss
30