Lumber Liquidators 2012 Annual Report Download - page 35
Download and view the complete annual report
Please find page 35 of the 2012 Lumber Liquidators annual report below. You can navigate through the pages in the report by either clicking on the pages listed below, or by using the keyword search tool below to find specific information within the annual report.-
 1
1 -
2
-
3
-
4
-
5
-
6
-
7
-
8
-
9
-
10
-
11
-
12
-
13
-
14
-
15
-
16
-
17
-
18
-
19
-
20
-
21
-
22
-
23
-
24
-
 25
25 -
 26
26 -
 27
27 -
 28
28 -
 29
29 -
 30
30 -
 31
31 -
 32
32 -
 33
33 -
 34
34 -
 35
35 -
 36
36 -
 37
37 -
 38
38 -
 39
39 -
 40
40 -
 41
41 -
 42
42 -
 43
43 -
 44
44 -
 45
45 -
46
-
47
-
48
-
49
-
50
-
51
-
52
-
53
-
54
-
55
-
56
-
57
-
58
-
59
-
60
-
61
-
62
-
63
-
64
-
65
-
66
-
67
-
68
-
69
-
70
-
71
-
72
 |
 |

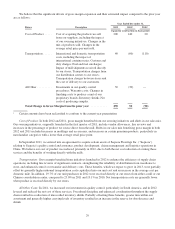
We believe that the significant drivers of gross margin expansion and their estimated impact compared to the prior year
are as follows:
Year Ended December 31,
Driver Description 2012 2011120101
expansion (contraction) in basis points
Cost of Product ..... Cost of acquiring the products we sell
from our suppliers, including the impact
of our sourcing initiatives; Changes in the
mix of products sold; Changes in the
average retail price per unit sold.
200 140 20
Transportation ...... International and domestic transportation
costs, including the impact of
international container rates; Customs and
duty charges; Fuel and fuel surcharges;
Impact of mill shipments received directly
by our stores; Transportation charges from
our distribution centers to our stores;
Transportation charges between stores and
the cost of delivery to our customers.
40 (60) (110)
All Other .......... Investments in our quality control
procedures; Warranty costs; Changes in
finishing costs to produce a unit of our
proprietary brands; Inventory shrink; Net
costs of producing samples.
30 (30) —
Total Change in Gross Margin from the prior year ........... 270 50 (90)
1Certain amounts have been reclassified to conform to the current year presentation.
Cost of Product: In both 2012 and 2011, gross margin benefited from our sourcing initiatives and shifts in our sales mix.
Our sourcing initiatives, originally launched in the first quarter of 2011, include vendor allowances, line reviews and
increases in the percentage of product we source direct from the mill. Shifts in our sales mix benefiting gross margin in both
2012 and 2011 included increases in moldings and accessories, and increases in certain premium products, particularly in
merchandise categories with a lower than average retail price point.
In September 2011, we entered into an agreement to acquire certain assets of Sequoia Floorings Inc. (“Sequoia”)
relating to Sequoia’s quality control and assurance, product development, claims management and logistics operations in
China. We believe our cost of product was reduced, primarily in 2012, due to both the net cost reduction of owning those
services and the benefits of working directly with the mills.
Transportation: Gross margin benefited from initiatives launched in 2012 to enhance the efficiency of supply chain
operations, including line reviews of significant contracts, strengthening the reliability of distribution from warehouse to
store, and enhanced control over transfer and delivery costs. These benefits, which we expect to grow in 2013, were partially
offset by generally higher inbound transportation costs capitalized into our unit cost and an increase in the average cost per
domestic mile. In addition, 19.7% of our unit purchases in 2012 were received directly at our stores from either a mill or our
Chinese consolidation center, compared to 23.0% in 2011 and 19.1% in 2010. Net transportation costs are generally lower
when product is received directly by our stores.
All Other Costs: In 2011, we increased our investment in quality control, particularly in South America, and in 2012
levered and reduced the net cost of those services. Procedural discipline and enhanced coordination throughout the supply
chain resulted in a reduction of unrecorded inventory shrink. Partially offsetting these benefits, greater turn within our
assortment and generally higher carrying levels of inventory resulted in an increase in the reserve for obsolescence and
shrink.
29