Lumber Liquidators 2012 Annual Report Download - page 32
Download and view the complete annual report
Please find page 32 of the 2012 Lumber Liquidators annual report below. You can navigate through the pages in the report by either clicking on the pages listed below, or by using the keyword search tool below to find specific information within the annual report.-
 1
1 -
2
-
3
-
4
-
5
-
6
-
7
-
8
-
9
-
10
-
11
-
12
-
13
-
14
-
15
-
16
-
17
-
18
-
19
-
20
-
21
-
 22
22 -
 23
23 -
 24
24 -
 25
25 -
 26
26 -
 27
27 -
 28
28 -
 29
29 -
 30
30 -
 31
31 -
 32
32 -
 33
33 -
 34
34 -
 35
35 -
 36
36 -
 37
37 -
 38
38 -
 39
39 -
 40
40 -
 41
41 -
 42
42 -
43
-
44
-
45
-
46
-
47
-
48
-
49
-
50
-
51
-
52
-
53
-
54
-
55
-
56
-
57
-
58
-
59
-
60
-
61
-
62
-
63
-
64
-
65
-
66
-
67
-
68
-
69
-
70
-
71
-
72
 |
 |

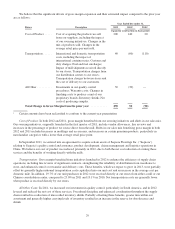
(1) Working capital is defined as current assets minus current liabilities.
(2) Average sale, calculated on a total company basis, is defined as the average invoiced sale per customer, measured on a monthly
basis and excluding transactions of less than $250 (which are generally sample orders, or add-ons or fill-ins to previous orders)
and of more than $30,000 (which are usually contractor orders).
Item 7. Management’s Discussion and Analysis of Financial Condition and Results of Operations.
Overview and Trends
Lumber Liquidators is the largest specialty retailer of hardwood flooring in North America. We believe we have
achieved a reputation for offering great value, superior service and a broad selection of high-quality hardwood flooring
products. We offer an extensive selection of premium hardwood flooring products under multiple proprietary brands at low
prices designed to appeal to a diverse customer base. We believe that our vertically integrated business model enables us to
offer a broad assortment of high-quality products to our customers at a lower cost than our competitors. At December 31,
2012, we sold our products through 288 Lumber Liquidators stores in 46 states in the U.S. and in Canada, a call center,
websites and catalogs.
In 2012, we implemented, or continued the implementation of, certain key, multi-year strategic initiatives to enhance
our value proposition to the customer and improve our operating margin, including:
•Broadening the reach and frequency of our advertising to increase the recognition of our value proposition and
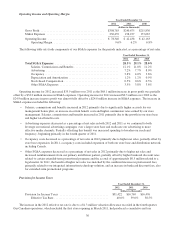
ultimately the number of customers served. In comparing 2012 to 2011, we increased our advertising spend by
$6.2 million, or 11.9%, and total net sales increased $131.7 million, or 19.3%. Though our primary focus remains
on the more passionate DIY customer, we believe our value proposition is reaching, and resonating with, a more
casual consumer. In 2012, the total number of customers invoiced in our stores increased 16.4% over 2011, and in
our comparable stores, increased 8.6%.
•Gross margin expansion through continued execution of our sourcing initiatives and optimization of our supply
chain. We are committed to reducing the net cost of product while we broaden our assortment, strengthen
availability and increase the attachment rates of moldings and accessories, including flooring tools. In comparing
2012 to 2011, gross margin improved 270 basis points. We introduced over 50 new floors in 2012, primarily
premium selections with gross margins higher than our average. Within our sales mix, moldings and accessories
increased 170 basis points over 2011 to represent 16.3% of net sales.
•Continuous improvement in our operations by developing the best people to serve our customers or to serve
those who do. In 2012, we strengthened the retail expertise across the Company through a combination of
expanded training and reward programs. Our focus remained on a commitment to excellence and a one-team
culture. We believe this focus led to more efficient and effective operations, facilitating incremental net sales,
higher gross margin and selling, general and administrative (“SG&A”) expense leverage. In 2012, exclusive of
certain management bonuses, SG&A expenses were 130 basis points lower as a percentage of net sales than in
2011. Total operating margin increased 340 basis points to 9.6%.
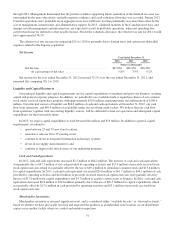
In 2013, we will continue to reinvest a portion of the benefits from these multi-year initiatives into the growth of our
core business, driving annual operating income increases. We expect to aggressively broaden the reach and frequency of our
advertising, and as a result, that expense may increase proportionate to, or even greater than, the net sales increase. We also
intend to continue to implement both our sourcing initiatives and efforts to optimize our supply chain in 2013. Together, we
believe gross margin will continue to expand in the future, though the incremental increase in 2013 is likely to be less than
the increase in 2012. Our culture is focused on identifying and rewarding superior performance. In 2013, we will adjust
certain management bonuses and equity awards to strengthen retention of our best people and better align their efforts with
the long-term growth of operating income. We believe the continued focus on increasing the efficiency and effectiveness of
our operations will continue to drive operating margin expansion in the future, though the incremental increase in 2013 is
likely to be less than the increase in 2012.
We operate primarily in the highly fragmented wood flooring market for existing homeowners. This market is
dependent on home-related, large-ticket discretionary spending, which is influenced by a number of complex economic and
demographic factors that may vary locally, regionally and nationally. In 2012, a number of these factors stabilized or
improved, though remain at historically low levels. We believe our customer will remain cautious and price sensitive in
2013, with a number of macroeconomic risks providing uncertainty, and potentially volatile demand, even as a multi-year
recovery in home remodeling may be forming.
26