Lumber Liquidators 2012 Annual Report Download - page 38
Download and view the complete annual report
Please find page 38 of the 2012 Lumber Liquidators annual report below. You can navigate through the pages in the report by either clicking on the pages listed below, or by using the keyword search tool below to find specific information within the annual report.-
 1
1 -
2
-
3
-
4
-
5
-
6
-
7
-
8
-
9
-
10
-
11
-
12
-
13
-
14
-
15
-
16
-
17
-
18
-
19
-
20
-
21
-
22
-
23
-
24
-
25
-
26
-
27
-
 28
28 -
 29
29 -
 30
30 -
 31
31 -
 32
32 -
 33
33 -
 34
34 -
 35
35 -
 36
36 -
 37
37 -
 38
38 -
 39
39 -
 40
40 -
 41
41 -
 42
42 -
 43
43 -
 44
44 -
 45
45 -
 46
46 -
 47
47 -
 48
48 -
49
-
50
-
51
-
52
-
53
-
54
-
55
-
56
-
57
-
58
-
59
-
60
-
61
-
62
-
63
-
64
-
65
-
66
-
67
-
68
-
69
-
70
-
71
-
72
 |
 |

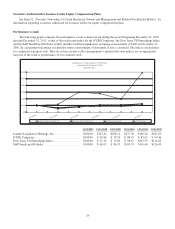
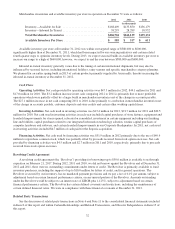
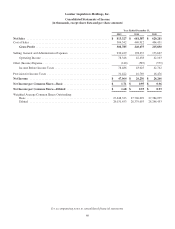
Merchandise inventories and available inventory per store in operation on December 31 were as follows:
2012 2011 2010
(in thousands)
Inventory—Available for Sale ............................ $168,409 $135,850 $136,179
Inventory—Inbound In-Transit ............................ 38,295 28,289 18,952
Total Merchandise Inventories .......................... $206,704 $164,139 $155,131
Available Inventory Per Store ........................... $ 585 $ 517 $ 611
Available inventory per store at December 31, 2012 was within our targeted range of $580,000 to $600,000,
significantly higher than at December 31, 2011, which had been impacted by our sourcing initiatives and certain related
fourth quarter steps to optimize inventory levels. During 2013, we expect seasonal builds in available inventory per store to
increase our range to a high of $660,000, however, we expect to end the year between $580,000 and $600,000.
Inbound in-transit inventory generally varies due to the timing of certain international shipments, but may also be
influenced by seasonal factors, including international holidays, rainy seasons and specific merchandise category planning.
We planned for an earlier spring build in 2013 of certain products primarily supplied by Asian mills, thereby increasing the
inbound in-transit inventory at December 31, 2012.
Cash Flows
Operating Activities. Net cash provided by operating activities was $47.3 million for 2012, $44.1 million for 2011 and
$17.0 million for 2010. The $3.2 million increase in net cash comparing 2012 to 2011 is primarily due to more profitable
operations which were partially offset by a larger build in merchandise inventories net of the change in accounts payable.
The $27.1 million increase in net cash comparing 2011 to 2010 is due primarily to a reduction in merchandise inventories net
of the change in accounts payable, customer deposits and store credits and certain other working capital items.
Investing Activities. Net cash used in investing activities was $13.4 million for 2012, $21.7 million for 2011 and $20.5
million for 2010. Net cash used in investing activities in each year included capital purchases of store fixtures, equipment and
leasehold improvements for stores opened, relocated or remodeled, investment in certain equipment including our finishing
line and forklifts, capital purchases related to our integrated information technology solution, routine capital purchases of
computer hardware and software, and certain leasehold improvements in our Corporate Headquarters. In 2011, net cash used
in investing activities included $4.7 million of cash paid for the Sequoia acquisition.
Financing Activities. Net cash used by financing activities was $31.9 million in 2012 primarily due to the use of $49.4
million to repurchase common stock, which was partially offset by proceeds received from stock option exercises. Net cash
provided by financing activities was $4.5 million and $2.7 million in 2011 and 2010, respectively, primarily due to proceeds
received from stock option exercises.
Revolving Credit Agreement
A revolving credit agreement (the “Revolver”) providing for borrowings up to $50.0 million is available to us through
expiration on February 21, 2017. During 2012, 2011 and 2010, we did not borrow against the Revolver and at December 31,
2012 and 2011, there were no outstanding commitments under letters of credit. The Revolver is primarily available to fund
inventory purchases, including the support of up to $10.0 million for letters of credit, and for general operations. The
Revolver is secured by our inventory, has no mandated payment provisions and we pay a fee of 0.1% per annum, subject to
adjustment based on certain financial performance criteria, on any unused portion of the Revolver. Amounts outstanding
under the Revolver would be subject to an interest rate of LIBOR plus 1.125%, subject to adjustment based on certain
financial performance criteria. The Revolver has certain defined covenants and restrictions, including the maintenance of
certain defined financial ratios. We were in compliance with these financial covenants at December 31, 2012.
Related Party Transactions
See the discussion of related party transactions in Note 6 and Note 11 to the consolidated financial statements included
in Item 8 of this report and within Certain Relationships and Related Transactions, and Director Independence in Item 13 of
this report.
32