Lumber Liquidators 2012 Annual Report Download - page 55
Download and view the complete annual report
Please find page 55 of the 2012 Lumber Liquidators annual report below. You can navigate through the pages in the report by either clicking on the pages listed below, or by using the keyword search tool below to find specific information within the annual report.-
 1
1 -
2
-
3
-
4
-
5
-
6
-
7
-
8
-
9
-
10
-
11
-
12
-
13
-
14
-
15
-
16
-
17
-
18
-
19
-
20
-
21
-
22
-
23
-
24
-
25
-
26
-
27
-
28
-
29
-
30
-
31
-
32
-
33
-
34
-
35
-
36
-
37
-
38
-
39
-
40
-
41
-
42
-
43
-
44
-
 45
45 -
 46
46 -
 47
47 -
 48
48 -
 49
49 -
 50
50 -
 51
51 -
 52
52 -
 53
53 -
 54
54 -
 55
55 -
 56
56 -
 57
57 -
 58
58 -
 59
59 -
 60
60 -
 61
61 -
 62
62 -
 63
63 -
 64
64 -
 65
65 -
66
-
67
-
68
-
69
-
70
-
71
-
72
 |
 |

Lumber Liquidators Holdings, Inc.
Notes to Consolidated Financial Statements—(Continued)
(amounts in thousands, except share data and per share amounts)
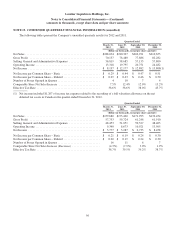
NOTE 6. LEASES
The Company has operating leases for its stores, Corporate Headquarters, supplemental office and distribution facilities
and certain equipment. The store location leases are operating leases and generally have five-year base periods with one or
more five-year renewal periods.
As of December 31, 2012, 2011 and 2010, the Company leased 27, 25 and 27 of its locations, representing 9.7%, 9.5%
and 12.1% of the total number of store leases in operation, respectively, and the Corporate Headquarters from entities
controlled by the Company’s founder (“Controlled Companies”). The Corporate Headquarters has an operating lease with a
base term running through December 31, 2019.
Rental expense is as follows:
Year Ended December 31,
2012 2011 2010
Rental expense .................................................... $18,826 $16,575 $13,784
Rental expense related to Controlled Companies ......................... 2,725 2,718 2,635
The future minimum rental payments under non-cancellable operating leases, segregating Controlled Companies leases
from all other operating leases, were as follows at December 31, 2012:
Operating Leases
Controlled Companies Store &
Other
Leases
Total
Operating
Leases
Store
Leases
Headquarters
Lease
2013 ................................................ $1,566 $1,163 $16,401 $19,130
2014 ................................................ 1,212 1,198 14,243 16,653
2015 ................................................ 953 1,234 12,139 14,326
2016 ................................................ 530 1,271 9,484 11,285
2017 ................................................ 229 1,309 5,813 7,351
Thereafter ........................................... 364 2,737 5,370 8,471
Total minimum lease payments ........................... $4,854 $8,912 $63,450 $77,216
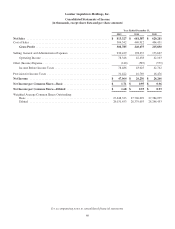
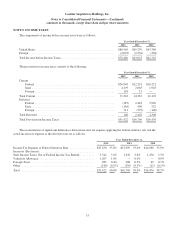
NOTE 7. STOCKHOLDERS’ EQUITY
Net Income per Common Share
The following table sets forth the computation of basic and diluted net income per common share:
Year Ended December 31,
2012 2011 2010
Net Income ....................................................... $ 47,064 $ 26,256 $ 26,266
Weighted Average Common Shares Outstanding—Basic ................... 27,448,333 27,706,629 27,384,095
Effect of Dilutive Securities:
Common Stock Equivalents ...................................... 583,120 673,064 862,358
Weighted Average Common Shares Outstanding—Diluted ................. 28,031,453 28,379,693 28,246,453
Net Income per Common Share—Basic ................................ $ 1.71 $ 0.95 $ 0.96
Net Income per Common Share—Diluted ............................... $ 1.68 $ 0.93 $ 0.93
49