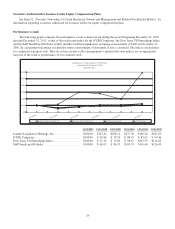
Lumber Liquidators 2012 Annual Report Download - page 37
Download and view the complete annual report
Please find page 37 of the 2012 Lumber Liquidators annual report below. You can navigate through the pages in the report by either clicking on the pages listed below, or by using the keyword search tool below to find specific information within the annual report.-
 1
1 -
2
-
3
-
4
-
5
-
6
-
7
-
8
-
9
-
10
-
11
-
12
-
13
-
14
-
15
-
16
-
17
-
18
-
19
-
20
-
21
-
22
-
23
-
24
-
25
-
26
-
 27
27 -
 28
28 -
 29
29 -
 30
30 -
 31
31 -
 32
32 -
 33
33 -
 34
34 -
 35
35 -
 36
36 -
 37
37 -
 38
38 -
 39
39 -
 40
40 -
 41
41 -
 42
42 -
 43
43 -
 44
44 -
 45
45 -
 46
46 -
 47
47 -
48
-
49
-
50
-
51
-
52
-
53
-
54
-
55
-
56
-
57
-
58
-
59
-
60
-
61
-
62
-
63
-
64
-
65
-
66
-
67
-
68
-
69
-
70
-
71
-
72
 |
 |

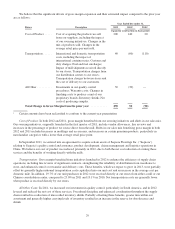
through 2012. Management determined that the positive evidence supporting future realization of the deferred tax asset was
outweighed by the more objectively verifiable negative evidence, and a full valuation allowance was recorded. During 2012,
Canadian operations were profitable on an aggregate store four-wall basis, but that profitability was more than offset by the
cost of management, infrastructure and administrative support. In 2013, continued maturity of the Canadian store base, and
changes in both management and infrastructure, are expected to result in profitable operations, where net operating loss
carryforwards may be utilized to offset taxable income. Absent the valuation allowance, the effective tax rate for 2012 would
have approximated 38.5%.
The effective tax rate increase in comparing 2011 to 2010 is primarily due to foreign taxes and certain non-deductible
expenses related to the Sequoia acquisition.
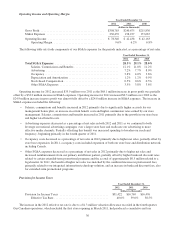
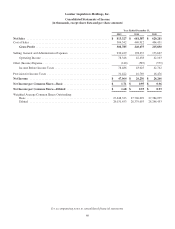
Net Income
Year Ended December 31,
2012 2011 2010
(dollars in thousands)
Net Income .............................................. $47,064 $26,256 $26,266
As a percentage of net sales ............................. 5.8% 3.9% 4.2%
Net income for the year ended December 31, 2012 increased 79.2% over the year ended December 31, 2011, and
remained flat comparing 2011 to 2010.
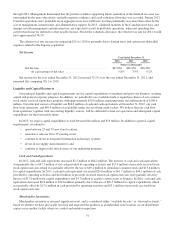
Liquidity and Capital Resources
Our principal liquidity and capital requirements are for capital expenditures to maintain and grow our business, working
capital and general corporate purposes. In addition, we periodically use available funds to repurchase shares of our common
stock under our stock repurchase program, with approximately $50.9 million remaining under our authorization of $100.0
million. Our principal sources of liquidity are $64.2 million of cash and cash equivalents at December 31, 2012, our cash
flow from operations, and $50.0 million of availability under our revolving credit facility. We believe that our cash flow
from operations, together with our existing liquidity sources, will be sufficient to fund our operations and anticipated capital
expenditures for the foreseeable future.
In 2013, we expect capital expenditures to total between $16 million and $19 million. In addition to general capital
requirements, we intend to:
• open between 25 and 35 new store locations;
• remodel or relocate 20 to 25 existing stores;
• continue to invest in integrated information technology systems;
• invest in our supply chain initiatives; and
• continue to improve the effectiveness of our marketing programs.
Cash and Cash Equivalents
In 2012, cash and cash equivalents increased $2.5 million to $64.2 million. The increase of cash and cash equivalents
was primarily due to $47.3 million of net cash provided by operating activities and $17.6 million of proceeds received from
stock option exercises which was partially offset by the use of $49.4 million to repurchase common stock and $13.4 million
for capital expenditures. In 2011, cash and cash equivalents increased $26.8 million to $61.7 million as $44.1 million of cash
provided by operating activities and $4.8 million of proceeds received from stock option exercises were partially offset by
the use of $17.0 million for capital expenditures and $4.7 million to acquire certain assets of Sequoia. In 2010, cash and cash
equivalents decreased $0.8 million to $34.8 million primarily due to the use of $20.5 million for capital expenditures which
was partially offset by $17.0 million in cash provided by operating activities and $3.1 million of proceeds received from
stock option exercises.
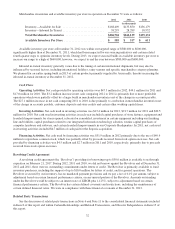
Merchandise Inventories
Merchandise inventory is our most significant asset, and is considered either “available for sale” or “inbound in-transit,”
based on whether we have physically received and inspected the products at an individual store location, in our distribution
centers or in another facility where we control and monitor inspection.
31