Logitech 2007 Annual Report Download - page 150
Download and view the complete annual report
Please find page 150 of the 2007 Logitech annual report below. You can navigate through the pages in the report by either clicking on the pages listed below, or by using the keyword search tool below to find specific information within the annual report.-
 1
1 -
2
-
3
-
4
-
5
-
6
-
7
-
8
-
9
-
10
-
11
-
12
-
13
-
14
-
15
-
16
-
17
-
18
-
19
-
20
-
21
-
22
-
23
-
24
-
25
-
26
-
27
-
28
-
29
-
30
-
31
-
32
-
33
-
34
-
35
-
36
-
37
-
38
-
39
-
40
-
41
-
42
-
43
-
44
-
45
-
46
-
47
-
48
-
49
-
50
-
51
-
52
-
53
-
54
-
55
-
56
-
57
-
58
-
59
-
60
-
61
-
62
-
63
-
64
-
65
-
66
-
67
-
68
-
69
-
70
-
71
-
72
-
73
-
74
-
75
-
76
-
77
-
78
-
79
-
80
-
81
-
82
-
83
-
84
-
85
-
86
-
87
-
88
-
89
-
90
-
91
-
92
-
93
-
94
-
95
-
96
-
97
-
98
-
99
-
100
-
101
-
102
-
103
-
104
-
105
-
106
-
107
-
108
-
109
-
110
-
111
-
112
-
113
-
114
-
115
-
116
-
117
-
118
-
119
-
120
-
121
-
122
-
123
-
124
-
125
-
126
-
127
-
128
-
129
-
130
-
131
-
132
-
133
-
134
-
135
-
136
-
137
-
138
-
139
-
 140
140 -
 141
141 -
 142
142 -
 143
143 -
 144
144 -
 145
145 -
 146
146 -
 147
147 -
 148
148 -
 149
149 -
 150
150 -
 151
151 -
 152
152 -
 153
153 -
 154
154 -
 155
155 -
 156
156 -
 157
157 -
 158
158 -
 159
159 -
 160
160 -
161
-
162
-
163
-
164
-
165
-
166
 |
 |

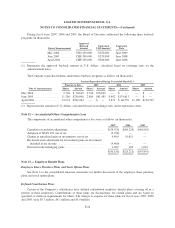
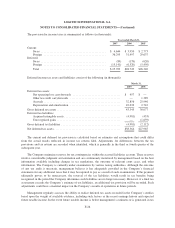
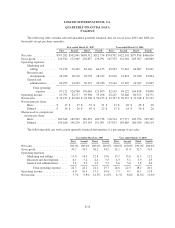
LOGITECH INTERNATIONAL S.A.
QUARTERLY FINANCIAL DATA
(Unaudited)
The following table contains selected unaudited quarterly financial data for fiscal years 2007 and 2006 (in
thousands except per share amounts):
Year ended March 31, 2007 Year ended March 31, 2006
First Second Third Fourth First Second Third Fourth
Net sales ............... $393,282 $502,041 $658,512 $512,734 $334,702 $422,101 $573,856 $466,056
Gross profit ............. 120,912 172,965 238,657 176,991 107,372 132,362 185,507 148,869
Operating expenses:
Marketing and
selling ........... 51,198 70,445 84,146 66,475 45,983 57,424 66,067 52,031
Research and
development ...... 24,928 26,118 28,778 28,432 21,018 21,491 22,380 23,064
General and
administrative ..... 20,995 24,225 26,137 26,786 15,144 15,207 16,387 19,003
Total operating
expense ...... 97,121 120,788 139,061 121,693 82,145 94,122 104,834 94,098
Operating income ........ 23,791 52,177 99,596 55,298 25,227 38,240 80,673 54,771
Net income ............. $ 30,147 $ 49,204 $ 94,304 $ 56,193 $ 22,397 $ 36,237 $ 71,348 $ 51,123
Net income per share:
Basic .............. $ .17 $ .27 $ .52 $ .31 $ .13 $ .20 $ .38 $ .28
Diluted ............. $ .16 $ .26 $ .49 $ .29 $ .12 $ .18 $ .36 $ .26
Shares used to compute net
income per share:
Basic .............. 182,648 182,502 182,652 182,738 176,914 177,377 185,794 185,365
Diluted ............. 190,646 190,276 191,145 191,091 197,813 199,669 200,380 196,114
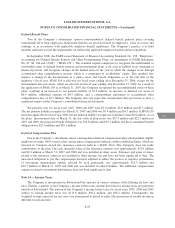
The following table sets forth certain quarterly financial information as a percentage of net sales:
Year ended March 31, 2007 Year ended March 31, 2006
First Second Third Fourth First Second Third Fourth
Net sales ........................ 100.0% 100.0% 100.0% 100.0% 100.0% 100.0% 100.0% 100.0%
Gross profit ..................... 30.7 34.5 36.2 34.5 32.1 31.4 32.3 31.9
Operating expenses:
Marketing and selling ......... 13.0 14.0 12.8 13.0 13.7 13.6 11.5 11.2
Research and development ..... 6.3 5.2 4.4 5.5 6.3 5.1 3.9 4.9
General and administrative ..... 5.4 4.9 3.9 5.2 4.6 3.6 2.8 4.0
Total operating expense .... 24.7 24.1 21.1 23.7 24.6 22.3 18.2 20.1
Operating income ................. 6.0 10.4 15.1 10.8 7.5 9.1 14.1 11.8
Net income ...................... 7.7% 9.8% 14.3% 11.0% 6.7% 8.6% 12.4% 11.0%
F-32