Logitech 2007 Annual Report Download - page 148
Download and view the complete annual report
Please find page 148 of the 2007 Logitech annual report below. You can navigate through the pages in the report by either clicking on the pages listed below, or by using the keyword search tool below to find specific information within the annual report.-
 1
1 -
2
-
3
-
4
-
5
-
6
-
7
-
8
-
9
-
10
-
11
-
12
-
13
-
14
-
15
-
16
-
17
-
18
-
19
-
20
-
21
-
22
-
23
-
24
-
25
-
26
-
27
-
28
-
29
-
30
-
31
-
32
-
33
-
34
-
35
-
36
-
37
-
38
-
39
-
40
-
41
-
42
-
43
-
44
-
45
-
46
-
47
-
48
-
49
-
50
-
51
-
52
-
53
-
54
-
55
-
56
-
57
-
58
-
59
-
60
-
61
-
62
-
63
-
64
-
65
-
66
-
67
-
68
-
69
-
70
-
71
-
72
-
73
-
74
-
75
-
76
-
77
-
78
-
79
-
80
-
81
-
82
-
83
-
84
-
85
-
86
-
87
-
88
-
89
-
90
-
91
-
92
-
93
-
94
-
95
-
96
-
97
-
98
-
99
-
100
-
101
-
102
-
103
-
104
-
105
-
106
-
107
-
108
-
109
-
110
-
111
-
112
-
113
-
114
-
115
-
116
-
117
-
118
-
119
-
120
-
121
-
122
-
123
-
124
-
125
-
126
-
127
-
128
-
129
-
130
-
131
-
132
-
133
-
134
-
135
-
136
-
137
-
 138
138 -
 139
139 -
 140
140 -
 141
141 -
 142
142 -
 143
143 -
 144
144 -
 145
145 -
 146
146 -
 147
147 -
 148
148 -
 149
149 -
 150
150 -
 151
151 -
 152
152 -
 153
153 -
 154
154 -
 155
155 -
 156
156 -
 157
157 -
 158
158 -
159
-
160
-
161
-
162
-
163
-
164
-
165
-
166
 |
 |

LOGITECH INTERNATIONAL S.A.
NOTES TO CONSOLIDATED FINANCIAL STATEMENTS—(Continued)
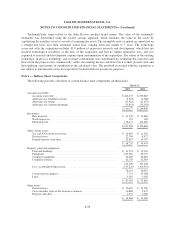
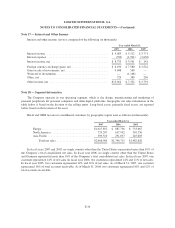
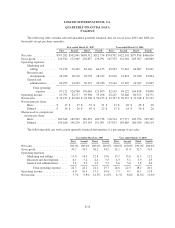
Note 17 — Interest and Other Income
Interest and other income, net was comprised of the following (in thousands):
Year ended March 31,
2007 2006 2005
Interest income .......................................... $ 9,083 $ 5,512 $ 3,771
Interest expense .......................................... (350) (1,921) (3,630)
Interest income, net ....................................... $ 8,733 $ 3,591 $ 141
Foreign currency exchange gains, net ......................... $ 6,190 $ 7,580 $ 3,522
Gain on sale of investments, net ............................. 9,048 560 —
Write-off of investments ................................... — (1,168) —
Other, net ............................................... 724 380 269
Other income, net ........................................ $15,962 $ 7,352 $ 3,791
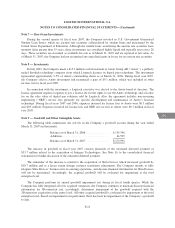
Note 18 — Segment Information
The Company operates in one operating segment, which is the design, manufacturing and marketing of
personal peripherals for personal computers and other digital platforms. Geographic net sales information in the
table below is based on the location of the selling entity. Long-lived assets, primarily fixed assets, are reported
below based on the location of the asset.
Retail and OEM net sales to unaffiliated customers by geographic region were as follows (in thousands):
Year ended March 31,
2007 2006 2005
Europe ................................. $1,027,852 $ 887,736 $ 733,667
North America ........................... 729,207 617,942 503,356
Asia Pacific ............................. 309,510 291,037 245,603
Total net sales ....................... $2,066,569 $1,796,715 $1,482,626
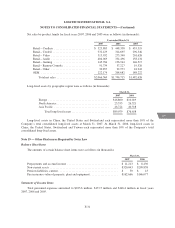
In fiscal years 2007 and 2005, no single country other than the United States represented more than 10% of
the Company’s total consolidated net sales. In fiscal year 2006, no single country other than the United States
and Germany represented more than 10% of the Company’s total consolidated net sales. In fiscal year 2007, one
customer represented 14% of net sales. In fiscal year 2006, two customers represented 14% and 11% of net sales.
In fiscal year 2005, two customers represented 14% and 10% of net sales. As of March 31, 2007, one customer
represented 16% of total accounts receivable. As of March 31, 2006, two customers represented 16% and 12% of
total accounts receivable.
F-30