JetBlue Airlines 2012 Annual Report Download - page 67
Download and view the complete annual report
Please find page 67 of the 2012 JetBlue Airlines annual report below. You can navigate through the pages in the report by either clicking on the pages listed below, or by using the keyword search tool below to find specific information within the annual report.-
 1
1 -
2
-
3
-
4
-
5
-
6
-
7
-
8
-
9
-
10
-
11
-
12
-
13
-
14
-
15
-
16
-
17
-
18
-
19
-
20
-
21
-
22
-
23
-
24
-
25
-
26
-
27
-
28
-
29
-
30
-
31
-
32
-
33
-
34
-
35
-
36
-
37
-
38
-
39
-
40
-
41
-
42
-
43
-
44
-
45
-
46
-
47
-
48
-
49
-
50
-
51
-
52
-
53
-
54
-
55
-
56
-
 57
57 -
 58
58 -
 59
59 -
 60
60 -
 61
61 -
 62
62 -
 63
63 -
 64
64 -
 65
65 -
 66
66 -
 67
67 -
 68
68 -
 69
69 -
 70
70 -
 71
71 -
 72
72 -
 73
73 -
 74
74 -
 75
75 -
 76
76 -
 77
77 -
78
-
79
-
80
-
81
-
82
-
83
-
84
-
85
-
86
-
87
-
88
-
89
-
90
-
91
-
92
 |
 |

JETBLUE AIRWAYS CORPORATION-2012 10K 63
PART II
ITEM 8Financial Statements and Supplementary Data
BetaBlue, an Airbus A320 aircraft, which utilized the acquired spectrum
in delivering email and internet capabilities to our customers. Since 2007,
LiveTV continued to develop this technology, with the intent of making
it available on all of our aircraft. However, with the introduction of similar
service by competitors, we re-evaluated the long term viability of our
planned offering and during 2010, ceased further development of the air-
to-ground platform.In September 2010, we announced plans to develop
broadband capability, partnering with ViaSat and utilizing their advanced
satellite technologies.As a result of the change in plans, we evaluated the
spectrum license for impairment, which resulted in a loss of approximately
$5 million being recorded in other operating expenses during 2010.We
determined the $2 million fair value of the spectrum license at December31,
2010 using a probability weighted cash fl ow model, which included an
income approach for the cash fl ows associated with the current general
aviation business as well as a market approach based on an independent
valuation.Since these inputs are not observable, they are classifi ed as
Level 3 inputs in the hierarchy. As of December31, 2012, we determined
there was no further impairment.
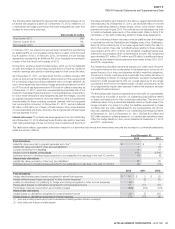
NOTE 15 Accumulated Other Comprehensive Income (Loss)
Comprehensive income includes changes in fair value of our aircraft fuel derivatives and interest rate swap agreements, which qualify for hedge
accounting. A rollforward of the amounts included in accumulated other comprehensive income (loss), net of taxes for the years ended December31,
2010, 2011 and 2012 is as follows (in millions):
AircraftFuel
Derivatives Interest
RateSwaps Total
Beginning accumulated gains (losses), at December31, 2009 $ 7 $ (6) $ 1
Reclassifi cations into earnings 3 5 8
Change in fair value (6) (13) (19)
Balance of accumulated gains (losses), at December31, 2010 4 (14) (10)
Reclassifi cations into earnings (1) 6 5
Change in fair value (6) (4) (10)
Balance of accumulated gains (losses), at December31, 2011 (3) (12) (15)
Reclassifi cations into earnings (6) 7 1
Change in fair value 8 (2) 6
ENDING ACCUMULATED GAINS (LOSSES), AT DECEMBER31, 2012 $ (1) $ (7) $ (8)
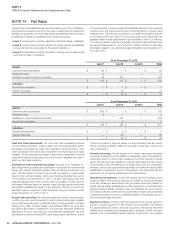
NOTE 16 Geographic Information
Under the Segment Reporting topic of the Codifi cation, disclosures are required for operating segments, which are regularly reviewed by the chief operating
decision makers. Air transportation services accounted for substantially all the Company’s operations in 2012, 2011 and 2010.
Operating revenues are allocated to geographic regions, as defi ned by the DOT, based upon the origination and destination of each fl ight segment. We currently
serve 21 locations in the Caribbean and Latin American region, or Latin America as defi ned by the DOT. However, our management also includes Puerto Rico
when reviewing the Caribbean region, and as such we have included our three destinations in Puerto Rico and two destinations in the U.S. Virgin Islands in our
Caribbean and Latin America allocation of revenues. Operating revenues by geographic regions for the years ended December 31 are summarized below (in millions):
2012 2011 2010
Domestic $ 3,666 $ 3,351 $ 2,900
Caribbean & Latin America 1,316 1,153 879
TOTAL $ 4,982 $ 4,504 $ 3,779
Our tangible assets primarily consist of our fl eet of aircraft, which is deployed system wide, with no individual aircraft dedicated to any specifi c route or
region; therefore our assets do not require any allocation to a geographic area.