JetBlue Airlines 2012 Annual Report Download - page 48
Download and view the complete annual report
Please find page 48 of the 2012 JetBlue Airlines annual report below. You can navigate through the pages in the report by either clicking on the pages listed below, or by using the keyword search tool below to find specific information within the annual report.
JETBLUE AIRWAYS CORPORATION-2012 10K44
PART II
ITEM 8Financial Statements and Supplementary Data
JetBlue Airways Corporation
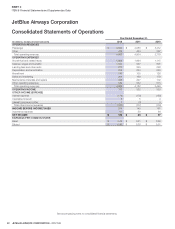
Consolidated Statements of Cash Flows
(in millions)
YearEndedDecember31,
2012 2011 2010
CASH FLOWS FROM OPERATING ACTIVITIES
Net income $128 $86 $97
Adjustments to reconcile net income to net cash provided by operating activities:
Deferred income taxes 76 58 62
Depreciation 230 213 194
Amortization 39 34 36
Stock-based compensation 13 13 17
(Gains) losses on sale of assets, debt extinguishment, and customer contract
termination (17) 6 —
Collateral (paid) returned for derivative instruments 8 10 (13)
Restricted cash refunded by business partners — — 5
Changes in certain operating assets and liabilities:
Decrease (increase) in receivables 1 (10) (4)
Decrease (increase) in inventories, prepaid and other 38 4 (4)
Increase in air traffi c liability 66 113 70
Increase in accounts payable and other accrued liabilities 92 26 27
Other, net 24 61 36
Net cash provided by operating activities 698 614 523
CASH FLOWS FROM INVESTING ACTIVITIES
Capital expenditures (542) (480) (249)
Predelivery deposits for fl ight equipment (284) (45) (50)
Refund of predelivery deposits for fl ight equipment 1 1 —
Proceeds from the sale of assets 46 — —
Assets constructed for others (2) (3) (14)
Purchase of held-to-maturity investments (444) (450) (866)
Proceeds from maturities of held-to-maturity investments 434 573 414
Purchase of available-for-sale securities (532) (602) (1,069)
Sale of available-for-sale securities 438 503 1,052
Sale of auction rate securities, or ARS — — 85
Net return of security deposits 18 1 1
Net cash used in investing activities (867) (502) (696)
CASH FLOWS FROM FINANCING ACTIVITIES
Proceeds from:
Issuance of common stock 9 10 9
Issuance of long-term debt 215 245 116
Short-term borrowings 375 128 —
Borrowings collateralized by ARS — — 20
Construction obligation — 6 15
Repayment of:
Long-term debt and capital lease obligations (418) (238) (333)
Short-term borrowings (463) (40) —
Borrowings collateralized by ARS — — (76)
Construction obligation (12) (10) (5)
Other, net (28) (5) (4)
Net cash provided by (used in) fi nancing activities (322) 96 (258)
INCREASE (DECREASE) IN CASH AND CASH EQUIVALENTS (491) 208 (431)
Cash and cash equivalents at beginning of period 673 465 896
Cash and cash equivalents at end of period $ 182 $ 673 $ 465
See accompanying notes to consolidated fi nancial statements.


