JetBlue Airlines 2012 Annual Report Download - page 32
Download and view the complete annual report
Please find page 32 of the 2012 JetBlue Airlines annual report below. You can navigate through the pages in the report by either clicking on the pages listed below, or by using the keyword search tool below to find specific information within the annual report.-
 1
1 -
2
-
3
-
4
-
5
-
6
-
7
-
8
-
9
-
10
-
11
-
12
-
13
-
14
-
15
-
16
-
17
-
18
-
19
-
20
-
21
-
 22
22 -
 23
23 -
 24
24 -
 25
25 -
 26
26 -
 27
27 -
 28
28 -
 29
29 -
 30
30 -
 31
31 -
 32
32 -
 33
33 -
 34
34 -
 35
35 -
 36
36 -
 37
37 -
 38
38 -
 39
39 -
 40
40 -
 41
41 -
 42
42 -
43
-
44
-
45
-
46
-
47
-
48
-
49
-
50
-
51
-
52
-
53
-
54
-
55
-
56
-
57
-
58
-
59
-
60
-
61
-
62
-
63
-
64
-
65
-
66
-
67
-
68
-
69
-
70
-
71
-
72
-
73
-
74
-
75
-
76
-
77
-
78
-
79
-
80
-
81
-
82
-
83
-
84
-
85
-
86
-
87
-
88
-
89
-
90
-
91
-
92
 |
 |
JETBLUE AIRWAYS CORPORATION-2012 10K28
PART II
ITEM7Management’s Discussion and Analysis of Financial Condition and Results of Operations
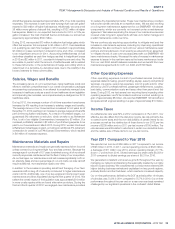
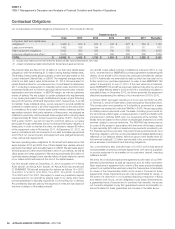
Operating Revenues
(Revenues in millions)
2012 2011
Year-over-Year Change
$%
Passenger Revenue $ 4,550 $ 4,080 $ 470 11.5
Other Revenue 432 424 8 2.0
Operating Revenues $ 4,982 $ 4,504 $ 478 10.6
Average Fare $ 157.11 $ 154.74 2.37 1.5
Yield per passenger mile (cents) 13.55 13.29 0.26 2.0
Passenger revenue per ASM (cents) 11.35 10.96 0.39 3.6
Operating revenue per ASM (cents) 12.43 12.10 0.33 2.8
Average stage length (miles) 1,085 1,091 (6) (0.5)
Revenue passengers (thousands) 28,956 26,370 2,586 9.8
Revenue passenger miles (millions) 33,563 30,698 2,865 9.3
Available Seat Miles (ASMs) 40,075 37,232 2,843 7.6
Load Factor 83.8% 82.4% 1.4 pts
We derive our revenue primarily from transporting passengers on our
aircraft. Passenger revenue accounted for 91% of our total operating
revenues for the year ended December31, 2012. Revenues generated
from international routes, including Puerto Rico, accounted for 26% of
our total passenger revenues in 2012. Revenue is recognized either when
transportation is provided or after the ticket or customer credit expires.
We measure capacity in terms of available seat miles, which represents
the number of seats available for passengers multiplied by the number
of miles the seats are fl own. Yield, or the average amount one passenger
pays to fl y one mile, is calculated by dividing passenger revenue by revenue
passenger miles. We attempt to increase passenger revenue primarily by
increasing our yield per fl ight which produces higher revenue per available
seat mile, or RASM. Our objective is to optimize our fare mix to increase
our overall average fare while continuing to provide our customers with
competitive fares. Passenger revenue also includes revenue from our
EvenMore™ Space ancillary product offering.
In 2012, the increase in passenger revenues was mainly attributable to
the increased capacity and increase in yield. Our EvenMore
™
Space seats
continued to be a signifi cant ancillary product, generating approximately
$150 million in revenue, an increase of approximately 19% over 2011
primarily as a result of additional EvenMore™ Space seats on our EMBRAER
190 fl eet, increased capacity and revised pricing.
Other revenue consists primarily of fees charged to customers in accordance
with our published policies. These include reservation changes and baggage
limitations, EvenMore™ Speed expedited security, the marketing component
of TrueBlue point sales, concession revenues, revenues associated with
transporting mail and cargo, revenues associated with the ground handling
of other airlines and rental income. Revenues earned by our subsidiary,
LiveTV, LLC, for the sale of, and on-going services provided for, in-fl ight
entertainment systems on other airlines are also included in Other Revenue.
Other revenue increased primarily as a result of an $18 million increase in
revenues from certain passenger related fees such as change fees and
excess baggage. These increased fees were slightly offset by a $10 million
guarantee recorded in 2011 related to our co-branded credit card.
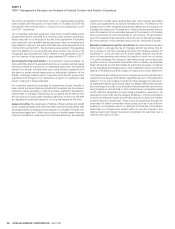
Operating Expenses
(dollars in millions)
2012 2011
Year-over-Year Change per ASM
$ % 2012 2011 % Change
Aircraft fuel and related taxes $ 1,806 $ 1,664 $ 142 8.6 4.50 4.47 0.9
Salaries, wages and benefi ts 1,044 947 97 10.3 2.60 2.54 2.4
Landing fees and other rents 277 245 32 12.8 0.69 0.66 4.8
Depreciation and amortization 258 233 25 10.5 0.65 0.63 2.7
Aircraft rent 130 135 (5) (3.6) 0.33 0.36 (10.4)
Sales and marketing 204 199 5 3.0 0.51 0.53 (4.3)
Maintenance materials and repairs 338 227 111 48.4 0.84 0.61 37.9
Other operating expenses 549 532 17 3.2 1.37 1.43 (4.1)
TOTAL OPERATING EXPENSES $ 4,606 $ 4,182 $ 424 10.1 11.49 11.23 2.3
Aircraft Fuel and Hedging
The price and availability of aircraft fuel are extremely volatile due to global
economic and geopolitical factors we can neither control nor accurately
predict. During 2012 fuel prices remained volatile, increasing 1% over
average 2011 prices. We maintain a diversifi ed fuel hedge portfolio by
entering into a variety of fuel hedge contracts in order to provide some
protection against sharp and sudden volatility and further increases in fuel
prices. In total, we hedged 30% of our total 2012 fuel consumption. We
also use fi xed forward price agreements, or FFPs, which allow us to lock
in a price for fi xed quantities of fuel to be delivered at a specifi ed date
in the future, to manage fuel price volatility. As of December31, 2012,
we had outstanding fuel hedge contracts covering approximately 8% of
our forecasted consumption for the fi rst quarter of 2013 and 5% for the
full year 2013. As of December 31, 2012, we had 6% of our 2013 fuel
consumption requirements covered under FFPs. In January and February
2013, we entered into jet fuel swap and cap agreements covering an
additional 6% of our 2013 forecasted consumption. We will continue to
monitor fuel prices closely and intend to take advantage of reasonable
fuel hedging opportunities as they become available.