JetBlue Airlines 2012 Annual Report Download - page 34
Download and view the complete annual report
Please find page 34 of the 2012 JetBlue Airlines annual report below. You can navigate through the pages in the report by either clicking on the pages listed below, or by using the keyword search tool below to find specific information within the annual report.
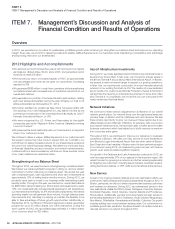
JETBLUE AIRWAYS CORPORATION-2012 10K30
PART II
ITEM7Management’s Discussion and Analysis of Financial Condition and Results of Operations
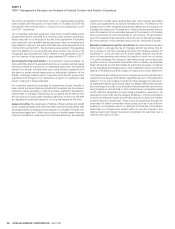
2011 vs 2010 Highlights
•
During the fi rst quarter of 2011, the winter storm season was extremely
severe. The operational impact of the severe storm season pressured our
CASM, excluding fuel, and negatively impacted our completion factor.
•
During the third quarter of 2011, Hurricane Irene severely impacted
our operations as its path travelled directly through the core of our
network. Flights were suspended in New York and Boston, resulting in
approximately 1400 cancellations over a three day period.
•
Operating capacity increased approximately 7% to 37.23billion available
seat miles in 2011.
•
Average fares for the year increased 10% over 2010 to $155, which
also resulted in an increase of $14 million in associated credit card fees.
•
Operating expenses per available seat mile increased 13% to 11.23 cents.
Excluding fuel, our cost per available seat mile increased 0.9% in 2011.
•
Invested in fi ve new owned EMBRAER 190 aircraft and four new owned
Airbus A320 aircraft, all of which were debt fi nanced.
•Opened seven new cities in 2011. Total departures increased 8%.
•Extended the leases on four aircraft during 2011 at lower rates.
•
The average age of our fl eet increased to 6.1 years, and as of December31,
2011, our oldest operating aircraft had an age of 12.1 years.
•
In 2010, we had several items impacting other operating expenses
which did not recur in 2011.
–
We incurred approximately $13 million in one-time implementation
expenses related to our new customer service system.
–
We recorded a $6 million one-time impairment expense related to the
intangible assets and other costs associated with developing an air
to ground connectivity capability.
–
We paid a $5 million rescheduling fee in connection with the deferral
of aircraft.
•
Early extinguishment of $39 million par value of our 6.75% Series A
convertible debt due 2039 resulted in $6 million in losses recorded in
interest income and other.
Operating Revenues
(Revenues in millions)
2011 2010
Year-over-Year Change
$%
Passenger Revenue 4,080 3,412 668 19.6
Other Revenue 424 367 57 15.3
Operating Revenues 4,504 3,779 725 19.2
Average Fare 154.74 140.69 14.05 10.0
Yield per passenger mile (cents) 13.29 12.07 1.22 10.2
Passenger revenue per ASM (cents) 10.96 9.82 1.14 11.6
Operating revenue per ASM (cents) 12.10 10.88 1.22 11.2
Average stage length (miles) 1,091 1,100 (9) (0.8)
Revenue passengers (thousands) 26,370 24,254 2.116 8.7
Revenue passenger miles (millions) 30,698 28,279 2,419 8.6
Available Seat Miles (ASMs) 37,232 34,744 2,488 7.2
Load Factor 82.4% 81.4% 1.0 pts
Passenger revenues increased 20% mainly attributable to the capacity
increase along with the increase in yield. Revenue from our Even More
Space seats increased $36 million as a result of increased capacity and
revised pricing.
Other revenue increased 15% as a result of a $17 million increase in
marketing related revenues as well as an $18 million increase in revenues
from certain passenger related fees such as change fees and excess
baggage. LiveTV third party revenues increased approximately $14 million.
Operating Expenses
(dollars in millions)
2011 2010
Year-over-Year Change per ASM
$ % 2011 2010 % Change
Aircraft fuel and related taxes $ 1,664 $ 1,115 $ 549 49.2 4.47 3.21 39.2
Salaries, wages and benefi ts 947 891 56 6.2 2.54 2.57 (0.9)
Landing fees and other rents 245 228 17 7.9 0.66 0.65 0.7
Depreciation and amortization 233 220 13 6.3 0.63 0.63 (0.8)
Aircraft rent 135 126 9 7.1 0.36 0.36 —
Sales and marketing 199 179 20 10.9 0.53 0.52 3.5
Maintenance materials and repairs 227 172 55 32.1 0.61 0.50 23.3
Other operating expenses 532 515 17 3.4 1.43 1.48 (3.5)
TOTAL OPERATING EXPENSES $ 4,182 $ 3,446 $ 736 21.4 11.23 9.92 13.3


