JetBlue Airlines 2012 Annual Report Download - page 38
Download and view the complete annual report
Please find page 38 of the 2012 JetBlue Airlines annual report below. You can navigate through the pages in the report by either clicking on the pages listed below, or by using the keyword search tool below to find specific information within the annual report.-
 1
1 -
2
-
3
-
4
-
5
-
6
-
7
-
8
-
9
-
10
-
11
-
12
-
13
-
14
-
15
-
16
-
17
-
18
-
19
-
20
-
21
-
22
-
23
-
24
-
25
-
26
-
27
-
 28
28 -
 29
29 -
 30
30 -
 31
31 -
 32
32 -
 33
33 -
 34
34 -
 35
35 -
 36
36 -
 37
37 -
 38
38 -
 39
39 -
 40
40 -
 41
41 -
 42
42 -
 43
43 -
 44
44 -
 45
45 -
 46
46 -
 47
47 -
 48
48 -
49
-
50
-
51
-
52
-
53
-
54
-
55
-
56
-
57
-
58
-
59
-
60
-
61
-
62
-
63
-
64
-
65
-
66
-
67
-
68
-
69
-
70
-
71
-
72
-
73
-
74
-
75
-
76
-
77
-
78
-
79
-
80
-
81
-
82
-
83
-
84
-
85
-
86
-
87
-
88
-
89
-
90
-
91
-
92
 |
 |
JETBLUE AIRWAYS CORPORATION-2012 10K34
PART II
ITEM7Management’s Discussion and Analysis of Financial Condition and Results of Operations
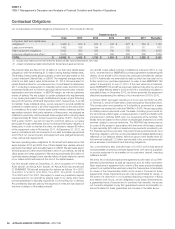
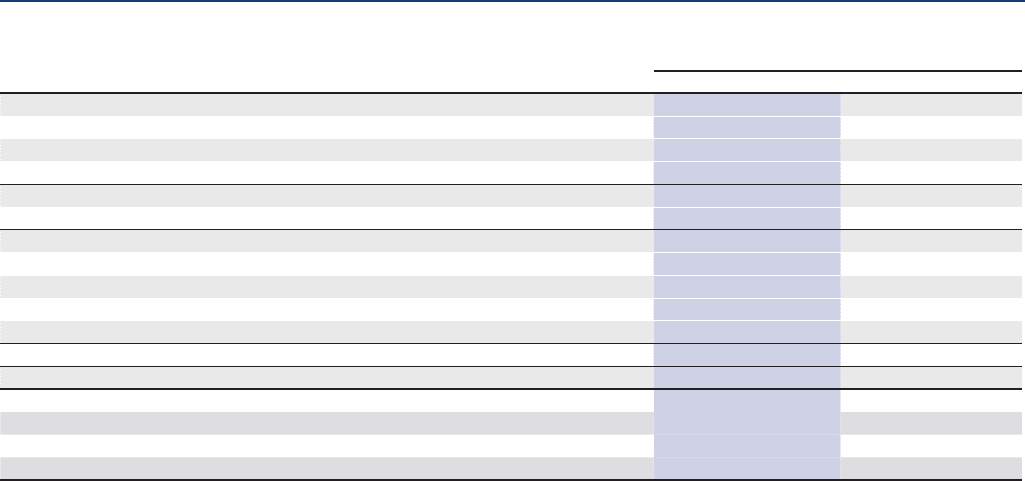
Return on Invested Capital
Return on invested capital, or ROIC, is an important fi nancial metric which
we believe provides meaningful information as to how well we generate
returns relative to the capital invested in our business. During 2012, we
improved our ROIC by nearly one percentage point to 4.8%. We are
committed to taking appropriate actions which will allow us to continue to
improve ROIC while adding capacity and continuing to grow. We believe
this non-GAAP measure provides a meaningful comparison of our results
to the airline industry and our prior year results. Investors should consider
this non-GAAP fi nancial measure in addition to, and not as a substitute for,
our fi nancial performance measures prepared in accordance with GAAP.
Reconciliation of Return on Invested Capital (Non-GAAP)
(in millions, except as otherwise noted)
Twelve Months Ended
December 31,
2012 2011
Numerator
Operating Income $ 376 $ 322
Add: Interest income and other 1 (3)
Add: Interest component of capitalized aircraft rent
(a) 68 71
Subtotal 445 390
Less: Income tax expense impact 172 153
Operating Income After Tax, Adjusted $ 273 $ 237
Denominator
Average Stockholders’ equity $ 1,822 $ 1,705
Average total debt 2,994 3,085
Capitalized aircraft rent
(a) 913 947
Invested Capital $ 5,729 $ 5,737
RETURN ON INVESTED CAPITAL 4.8% 4.1%
(a) Capitalized Aircraft Rent
Aircraft rent, as reported $ 130 $ 135
Capitalized aircraft rent (7 * Aircraft rent) 913 947
Interest component of capitalized aircraft rent (Imputed interest at 7.5%) 68 71
Analysis of Cash Flows
Operating Activities
At December31, 2012, we had cash and cash equivalents of $182 million
and short-term investments of $549 million, as compared to cash and cash
equivalents of $673 million and short-term investments of $553 million at
December31, 2011. We also had $136 million of long-term investments
at December31, 2012 compared to $38 million at December31, 2011.
Cash fl ows provided by operating activities totaled $698 million in 2012
compared to $614 million in 2011 and $523 million in 2010. The $84 million
increase in cash fl ows from operations in 2012 compared to 2011 was
primarily as a result of the 8% increase in capacity and 2% increase in
average fares, offset by a 1% higher price of fuel. The $91 million increase
in cash fl ows from operations in 2011 compared to 2010 was primarily
as a result of the 10% increase in average fares and 7% increase in
capacity, offset by 38% higher price of fuel. As of December31, 2012,
our unrestricted cash, cash equivalents and short-term investments as
a percentage of trailing twelve months revenue was approximately 15%.
We rely primarily on cash fl ows from operations to provide working capital
for current and future operations.
Investing Activities
During 2012, capital expenditures related to our purchase of fl ight equipment
included (1) $344million for seven Airbus A320 aircraft, four EMBRAER 190
aircraft and fi ve spare engines, (2) $283million for fl ight equipment deposits,
which includes a $200 million prepayment in exchange for favorable pricing
terms and (3) $32million for spare part purchases. Capital expenditures
for other property and equipment, including ground equipment purchases,
facilities improvements and LiveTV infl ight-entertainment equipment
inventory were $166 million, which includes the fi nal $32 million for the 16
slots we purchased at LaGuardia International Airport and Ronald Reagan
International Airport in 2011 and $17 million for T5i, which was paid for
using cash from operations. The receipt of $46 million in proceeds from
the sale of two EMBRAER 190 aircraft and six spare engines is included
in investing activities. Investing activities also include the net purchase of
$104 million in investment securities.
During 2011, capital expenditures related to our purchase of fl ight equipment
included $318 million for four Airbus A320 aircraft, fi ve EMBRAER 190
aircraft and nine spare engines, $44million for fl ight equipment deposits
and $27million for spare part purchases. Capital expenditures for other
property and equipment, including ground equipment purchases, facilities
improvements and LiveTV inventory, were $135million, which includes
$40 million for the 16 slots we purchased at LaGuardia International Airport
and Ronald Reagan International Airport. Investing activities in 2011 also
included the net proceeds from the sale and maturities of $24 million in
investment securities.
We currently anticipate 2013 capital expenditures for facility improvements,
spare parts and ground purchases to be approximately $245million,
including approximately $80 million for our investment at T5i.