JetBlue Airlines 2012 Annual Report Download - page 35
Download and view the complete annual report
Please find page 35 of the 2012 JetBlue Airlines annual report below. You can navigate through the pages in the report by either clicking on the pages listed below, or by using the keyword search tool below to find specific information within the annual report.-
 1
1 -
2
-
3
-
4
-
5
-
6
-
7
-
8
-
9
-
10
-
11
-
12
-
13
-
14
-
15
-
16
-
17
-
18
-
19
-
20
-
21
-
22
-
23
-
24
-
 25
25 -
 26
26 -
 27
27 -
 28
28 -
 29
29 -
 30
30 -
 31
31 -
 32
32 -
 33
33 -
 34
34 -
 35
35 -
 36
36 -
 37
37 -
 38
38 -
 39
39 -
 40
40 -
 41
41 -
 42
42 -
 43
43 -
 44
44 -
 45
45 -
46
-
47
-
48
-
49
-
50
-
51
-
52
-
53
-
54
-
55
-
56
-
57
-
58
-
59
-
60
-
61
-
62
-
63
-
64
-
65
-
66
-
67
-
68
-
69
-
70
-
71
-
72
-
73
-
74
-
75
-
76
-
77
-
78
-
79
-
80
-
81
-
82
-
83
-
84
-
85
-
86
-
87
-
88
-
89
-
90
-
91
-
92
 |
 |

JETBLUE AIRWAYS CORPORATION-2012 10K 31
PART II
ITEM7Management’s Discussion and Analysis of Financial Condition and Results of Operations
Aircraft Fuel and Hedging
Aircraft fuel expense increased 49%, and represented approximately 40%
of our total operating expenses. Average fuel cost per gallon increased
38% to $3.17 compared to $2.29 in 2010, resulting in $461 million of
higher fuel expense. Additionally, we consumed 39million more gallons
of aircraft fuel, resulting in $88million of higher fuel expense.
We hedged approximately 43% of our total 2011 fuel consumption.
We recorded $3 million in effective fuel hedge gains, which offset fuel
expense, versus $3 million in effective fuel hedge losses during 2010,
which were an increase to fuel expense. Accounting ineffectiveness on
fuel derivatives classifi ed as cash fl ow hedges resulted in losses of $2
million in each of 2011 and 2010, recorded in interest income and other.
We are unable to predict what the amount of ineffectiveness will be related
to these instruments, or the potential loss of hedge accounting which is
determined on a derivative-by-derivative basis, due to the volatility in the
forward markets for these commodities.
Salaries, Wages and Benefi ts
The increase in salaries, wages and benefi ts was primarily due to a 5% increase in the number of average number of full-time equivalent employees
needed to support our profi table growth plans. The increasing seniority levels of our Crewmembers combined with pay and benefi t increases also
contributed to higher expense.
Maintenance Materials and Repairs
Maintenance expense represented a signifi cant cost challenge in 2011, increasing $55 million. In addition to the additional operating aircraft and the aging
of our fl eet, several aircraft coming off of warranty contributed to higher maintenance costs. Maintenance expense is expected to increase signifi cantly
as our fl eet ages, as older aircraft need additional, more expensive repairs over time.
Income Taxes
Our effective tax rate was 41% in 2011 compared to 40% in 2010. Our effective tax rate differs from the statutory income tax rate primarily due to state
income taxes, the change in valuation allowance and the non-deductibility of certain items for tax purposes and the relative size of these items to our
2011 pre-tax income of $145 million and our 2010 pre-tax income of $161 million. The rate increase was due to a reduction in the valuation allowance
attributable to state net operating loss carryforwards in 2010.
Costs per Available Seat Mile (Non-GAAP)
Our costs per available seat mile, or CASM, a common metric used in
the airline industry, are summarized in the table below. We have listed
separately our fuel costs and profi t sharing expense. While these amounts
are included in CASM, we believe excluding fuel costs, which are subject
to many economic and political factors beyond our control, as well as profi t
sharing, which is sensitive to volatility in earnings, from this metric is useful
to management and investors. We believe this non-GAAP measure is more
indicative of our ability to manage our costs and provides a meaningful
comparison of our results to the airline industry and our prior year results.
Investors should consider this non-GAAP fi nancial measure in addition to,
and not as a substitute for, our fi nancial performance measures prepared
in accordance with GAAP.
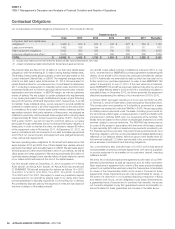
Reconciliation of Operating E xpense per ASM, excluding F uel and P rofi t S haring
(in millions, except per ASM data in cents)
2012 2011 Per ASM
Year-over-Year
Change %$ per ASM $ per ASM
Total operating expenses $ 4,606 11.49 $ 4,182 11.23 2.3%
Less: Aircraft fuel and related taxes 1,806 4.50 1,664 4.47 0.9
Operating expenses, excluding fuel 2,800 6.99 2,518 6.76 3.3
Less: Profi t sharing 3 0.01 — — —
OPERATING EXPENSE, EXCLUDING
FUEL & PROFIT SHARING $ 2,797 6.98 $ 2,518 6.76 3.2