JetBlue Airlines 2012 Annual Report Download - page 27
Download and view the complete annual report
Please find page 27 of the 2012 JetBlue Airlines annual report below. You can navigate through the pages in the report by either clicking on the pages listed below, or by using the keyword search tool below to find specific information within the annual report.-
 1
1 -
2
-
3
-
4
-
5
-
6
-
7
-
8
-
9
-
10
-
11
-
12
-
13
-
14
-
15
-
16
-
 17
17 -
 18
18 -
 19
19 -
 20
20 -
 21
21 -
 22
22 -
 23
23 -
 24
24 -
 25
25 -
 26
26 -
 27
27 -
 28
28 -
 29
29 -
 30
30 -
 31
31 -
 32
32 -
 33
33 -
 34
34 -
 35
35 -
 36
36 -
 37
37 -
38
-
39
-
40
-
41
-
42
-
43
-
44
-
45
-
46
-
47
-
48
-
49
-
50
-
51
-
52
-
53
-
54
-
55
-
56
-
57
-
58
-
59
-
60
-
61
-
62
-
63
-
64
-
65
-
66
-
67
-
68
-
69
-
70
-
71
-
72
-
73
-
74
-
75
-
76
-
77
-
78
-
79
-
80
-
81
-
82
-
83
-
84
-
85
-
86
-
87
-
88
-
89
-
90
-
91
-
92
 |
 |

PART II
JETBLUE AIRWAYS CORPORATION-2012 10K 23
ITEM5Market for Registrant’s Common Equity; Related Stockholder Matters andIssuer PurchasesofEquitySecurities
Stock Performance Graph
This performance graph shall not be deemed “fi led” with the SEC or subject to Section18 of the Exchange Act, nor shall it be deemed incorporated by
reference in any of our fi lings under the Securities Act of 1933, as amended.
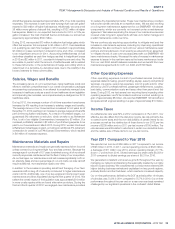
The following line graph compares the cumulative total stockholder return on our common stock with the cumulative total return of the Standard&
Poor’s 500 Stock Index and the NYSE Arca Airline Index from December31, 2007 to December31, 2012. The comparison assumes the investment of
$100 in our common stock and in each of the foregoing indices and reinvestment of all dividends. The stock performance shown represents historical
performance and is not representative of future stock performance.
NYSE Arca Airline Index(1)
JetBlue Airways Corporation S&P 500 Stock Index
12/31/07 12/31/1012/31/0912/31/08 12/31/11 12/31/12
In $
60
70
80
90
100
110
120
130
140
12/31/2007 12/31/2008 12/31/2009 12/31/2010 12/31/2011 12/31/2012
JetBlue Airways Corporation $ 100 $ 120 $ 92 $ 112 $ 88 $ 97
S&P 500 Stock Index $ 100 $ 63 $ 80 $ 92 $ 94 $ 109
NYSE Arca Airline Index(1) $ 100 $ 71 $ 99 $ 137 $ 95 $ 129
(1) As of December 31, 2012, the NYSE Arca Airline Index consisted of Alaska Air Group Inc., AMR Corporation, Copa Holdings S.A., Delta Air Lines, Inc., Gol Linhas Aereas Inteligentes S.A.,
Hawaiian Holdings, JetBlue Airways Corporation, US Airways Group, Inc., LAN Airlines S.A., Southwest Airlines Company, Republic Airways Holding, Inc., Ryanair Holdings Ads., SkyWest, Inc,
TAM S.A., and UAL Corporation.