Hyundai 2007 Annual Report Download - page 95
Download and view the complete annual report
Please find page 95 of the 2007 Hyundai annual report below. You can navigate through the pages in the report by either clicking on the pages listed below, or by using the keyword search tool below to find specific information within the annual report.-
 1
1 -
2
-
3
-
4
-
5
-
6
-
7
-
8
-
9
-
10
-
11
-
12
-
13
-
14
-
15
-
16
-
17
-
18
-
19
-
20
-
21
-
22
-
23
-
24
-
25
-
26
-
27
-
28
-
29
-
30
-
31
-
32
-
33
-
34
-
35
-
36
-
37
-
38
-
39
-
40
-
41
-
42
-
43
-
44
-
45
-
46
-
47
-
48
-
49
-
50
-
51
-
52
-
53
-
54
-
55
-
56
-
57
-
58
-
59
-
60
-
61
-
62
-
63
-
64
-
65
-
66
-
67
-
68
-
69
-
70
-
71
-
72
-
73
-
74
-
75
-
76
-
77
-
78
-
79
-
80
-
81
-
82
-
83
-
84
-
 85
85 -
 86
86 -
 87
87 -
 88
88 -
 89
89 -
 90
90 -
 91
91 -
 92
92 -
 93
93 -
 94
94 -
 95
95 -
 96
96 -
 97
97 -
 98
98 -
 99
99 -
 100
100 -
 101
101 -
 102
102 -
 103
103 -
 104
104 -
 105
105 -
106
-
107
-
108
-
109
-
110
-
111
-
112
-
113
-
114
-
115
-
116
-
117
-
118
-
119
-
120
-
121
-
122
-
123
-
124
 |
 |

93
HYUNDAI MOTOR COMPANY
NOTES TO CONSOLIDATED FINANCIAL STATEMENTS FOR THE YEARS ENDED DECEMBER 31, 2007 AND 2006
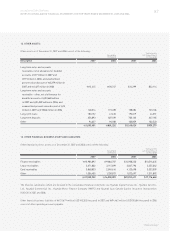
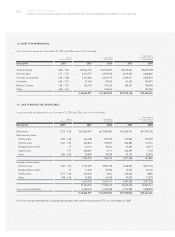
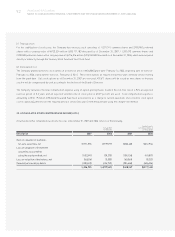
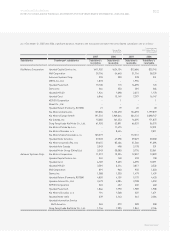
21. STATEMENTS OF COMPREHENSIVE INCOME:
Statements of comprehensive income in 2007 and 2006 consist of the following:
Korean Won
(In millions)
Translation into
U.S. Dollars (Note 2)
(In thousands)
Description 2007 2006 2007 2006
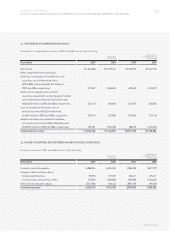
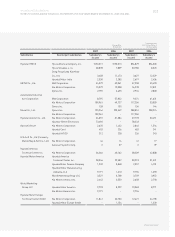
Income tax currently payable 848,494 504,555 $904,385 $537,790
Changes in deferred taxes due to:
Temporary differences 98,953 149,559 105,471 159,411
Carry forward of unused tax credits (27,206) (124,802) (28,998) (133,023)
Items directly charged to equity (267,508) 186,446 (285,129) 198,728
Income tax expense 652,733 715,758 $695,729 $762,906
Korean Won
(In millions)
Translation into
U.S. Dollars (Note 2)
(In thousands)
Description 2007 2006 2007 2006
Net income 1,600,480 1,259,247 $1,705,905 $1,342,195
Other comprehensive income (loss):
Gain (loss) on valuation of available-for-sale
securities, net of deferred tax effect
(216,896) million and 60,167 million in
2007 and 2006, respectively. 571,817 (158,623) 609,483 (169,072)
Gain (loss) on valuation of investment
securities accounted for using the equity method,
net of deferred tax effect 14,267 million and
(22,247) million in 2007 and 2006, respectively. (63,121) 206,950 (67,279) 220,582
Loss on valuation of derivatives, net of
deferred tax effect 20,301 million and
4,667 million in 2007 and 2006, respectively. (53,521) (12,305) (57,046) (13,116)
Gain(loss) on overseas operation translation,
net of deferred tax effect (64,138) million and
60,393 million in 2007 and 2006, respectively. 169,091 (159,218) 180,229 (169,705)
Comprehensive income 2,224,746 1,136,051 $2,371,292 $1,210,884
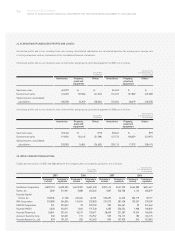
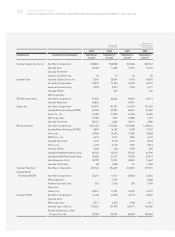
22. INCOME TAX EXPENSE AND DEFERRED INCOME TAX ASSETS (LIABILITIES):
Income tax expense in 2007 and 2006 consists of the following: