Hyundai 2007 Annual Report Download - page 80
Download and view the complete annual report
Please find page 80 of the 2007 Hyundai annual report below. You can navigate through the pages in the report by either clicking on the pages listed below, or by using the keyword search tool below to find specific information within the annual report.
78 HYUNDAI MOTOR COMPANY
NOTES TO CONSOLIDATED FINANCIAL STATEMENTS FOR THE YEARS ENDED DECEMBER 31, 2007 AND 2006
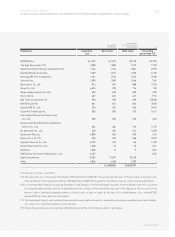
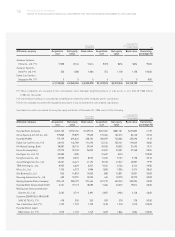
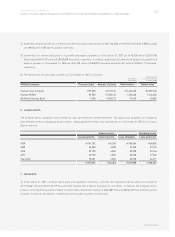
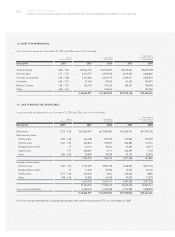
Affiliated company Acquisition Net equity Book value Acquisition Net equity Book value Ownership
cost value cost value percentage (*2)
Autoever Systems
China Co., Ltd. (*1) 538 614 614 $573 $654 $654 90.00
Autoever Systems
India Pvt. Ltd. (*1) 520 1,086 1,086 554 1,158 1,158 100.00
Eukor Car Carriers
Singapore Pte. (*1) 5 5 5 5 5 5 8.00
1,153,586 2,360,365 2,035,078 $1,229,574 $2,515,844 $2,169,130
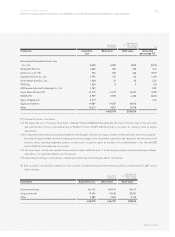
(*1) These companies are excluded in the consolidation since individual beginning balance of total assets is less than 7,000 million
(US$7,461 thousand).
(*2) Ownership percentage is calculated by combining the ownership of the Company and its subsidiaries.
(*3) As the company was under the liquidation procedure, it was excluded from consolidated subsidiaries.
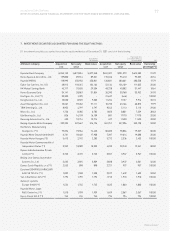
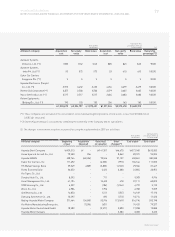
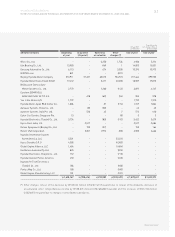
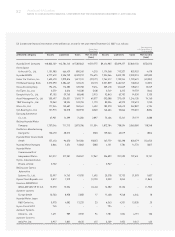
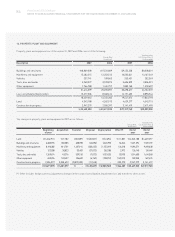
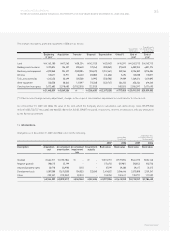
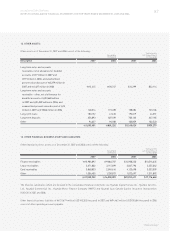
Investment securities accounted for using the equity method as of December 31, 2006 consist of the following:
(%)
Translation into
U.S. Dollars (Note 2)
(In thousands)
Korean Won
(In millions)
Affiliated company Acquisition Net equity Book value Acquisition Net equity Book value Ownership
cost value cost value percentage (*2)
Hyundai Steel Company 245,153 752,156 429,513 $261,301 $801,701 $457,805 21.39
Korea Space & Aircraft Co., Ltd. 159,800 95,895 79,503 170,326 102,212 84,740 22.23
Hyundai MOBIS 175,159 694,626 408,764 186,697 740,382 435,690 19.13
Eukor Car Carriers, Inc. (*2) 48,912 126,789 111,692 52,134 135,141 119,049 20.00
HK Mutual Savings Bank 38,087 28,176 29,549 40,596 30,032 31,495 19.31
Korea Economy Daily 29,973 22,133 26,052 31,947 23,591 27,768 20.55
Kia Tigers Co., Ltd. (*1) 20,300 (189) - 21,637 (201) - 100.00
Donghui Auto Co., Ltd. 10,530 8,572 8,592 11,224 9,137 9,158 35.10
Asset Management Co., Ltd. 10,067 44,421 41,194 10,730 47,347 43,907 19.99
TRW Steering Co., Ltd. 8,952 6,329 6,327 9,542 6,746 6,744 29.00
Wisco Co., Ltd. 1,736 6,573 4,986 1,850 7,006 5,314 38.63
Iljin Bearing Co., Ltd 826 14,853 14,853 880 15,831 15,831 20.00
Daesung Automotive Co., Ltd. 400 10,295 10,295 426 10,973 10,973 20.00
Beijing-Hyundai Motor Company 232,410 380,199 371,464 247,719 405,243 395,934 50.00
Hyundai Motor Deutschland GmbH 6,761 19,113 18,589 7,206 20,372 19,814 30.00
Beijing Lear Dymos Automotive
Systems Co., Ltd. 2,662 3,719 3,891 2,837 3,963 4,148 40.00
Eurotem DEMIRYOLU ARACLARI
SAN. VE TIC A.S. (*1) 478 355 355 509 378 378 50.50
Yan Ji Kia Motors A/S (*1) 1,792 1,792 1,792 1,910 1,910 1,910 100.00
Hyundai Motor Japan
R&D Center Inc. (*1) 1,510 1,749 1,749 1,609 1,864 1,864 100.00
(%)
Korean Won
(In millions)
Translation into
U.S. Dollars (Note 2)
(In thousands)


