Hyundai 2007 Annual Report Download - page 88
Download and view the complete annual report
Please find page 88 of the 2007 Hyundai annual report below. You can navigate through the pages in the report by either clicking on the pages listed below, or by using the keyword search tool below to find specific information within the annual report.-
 1
1 -
2
-
3
-
4
-
5
-
6
-
7
-
8
-
9
-
10
-
11
-
12
-
13
-
14
-
15
-
16
-
17
-
18
-
19
-
20
-
21
-
22
-
23
-
24
-
25
-
26
-
27
-
28
-
29
-
30
-
31
-
32
-
33
-
34
-
35
-
36
-
37
-
38
-
39
-
40
-
41
-
42
-
43
-
44
-
45
-
46
-
47
-
48
-
49
-
50
-
51
-
52
-
53
-
54
-
55
-
56
-
57
-
58
-
59
-
60
-
61
-
62
-
63
-
64
-
65
-
66
-
67
-
68
-
69
-
70
-
71
-
72
-
73
-
74
-
75
-
76
-
77
-
 78
78 -
 79
79 -
 80
80 -
 81
81 -
 82
82 -
 83
83 -
 84
84 -
 85
85 -
 86
86 -
 87
87 -
 88
88 -
 89
89 -
 90
90 -
 91
91 -
 92
92 -
 93
93 -
 94
94 -
 95
95 -
 96
96 -
 97
97 -
 98
98 -
99
-
100
-
101
-
102
-
103
-
104
-
105
-
106
-
107
-
108
-
109
-
110
-
111
-
112
-
113
-
114
-
115
-
116
-
117
-
118
-
119
-
120
-
121
-
122
-
123
-
124
 |
 |
86 HYUNDAI MOTOR COMPANY
NOTES TO CONSOLIDATED FINANCIAL STATEMENTS FOR THE YEARS ENDED DECEMBER 31, 2007 AND 2006
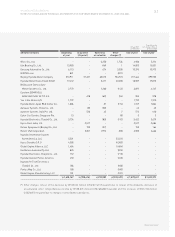
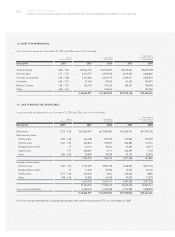
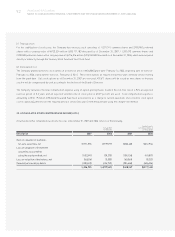
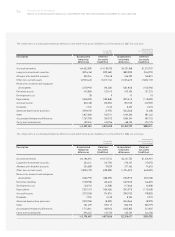
The changes in intangibles in 2007 are as follows:
Description Goodwill Negative Industrial Development Other Total Total
goodwill property costs
rights
Beginning of the year 519,894 (87,981) 29,380 2,046,446 104,611 2,612,350 $2,784,428
Addition:
Expenditures 39,448 - 9,908 983,694 39,061 1,072,111 1,142,732
Deduction:
Amortization (48,547) 5,268 (10,531) (608,565) (29,830) (692,205) (737,801)
Impairment loss - - (121) (993) - (1,114) (1,187)
Government subsidy - - - (10,538) - (10,538) (11,232)
Other (64) 9,241 (1,037) 4,778 4,362 17,280 18,417
End of the year 510,731 (73,472) 27,599 2,414,822 118,204 2,997,884 $3,195,357
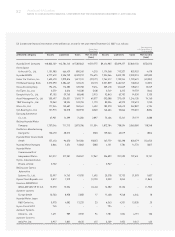
The changes in intangibles in 2006 are as follows:
Translation into
U.S. Dollars (Note 2)
(In thousands)
Korean Won
(In millions)
Description Goodwill Negative Industrial Development Other Total Total
goodwill property costs
rights
Beginning of the year 476,343 (86,421) 24,912 1,830,297 84,991 2,330,122 $2,483,609
Addition:
Expenditures 107,398 (8,015) 12,569 824,966 36,896 973,814 1,037,960
Deduction:
Amortization (64,520) 6,455 (9,830) (567,537) (19,296) (654,728) (697,855)
Impairment loss - - - (25,026) - (25,026) (26,674)
Government subsidy - - - (12,066) - (12,066) (12,861)
Other 673 - 1,729 (4,188) 2,020 234 249
End of the year 519,894 (87,981) 29,380 2,046,446 104,611 2,612,350 $2,784,428
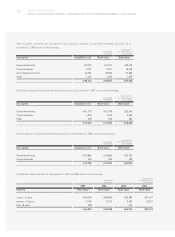
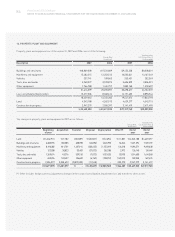
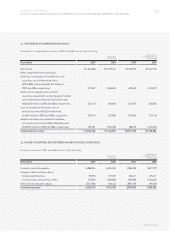
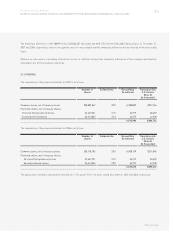
Research and development expenditures in 2007 and 2006 are as follows:
Translation into
U.S. Dollars (Note 2)
(In thousands)
Korean Won
(In millions)
Korean Won
(In millions)
Translation into
U.S. Dollars (Note 2)
(In thousands)
2007 2006 2007 2006
Development cost (capitalized) 983,694 824,966 $1,048,491 $879,307
Ordinary development
(manufacturing cost) 601,154 353,396 640,752 376,675
Research costs (SG&A) 608,631 636,611 648,722 678,545
2,193,479 1,814,973 $2,337,965 $1,934,527