Hyundai 2007 Annual Report Download - page 81
Download and view the complete annual report
Please find page 81 of the 2007 Hyundai annual report below. You can navigate through the pages in the report by either clicking on the pages listed below, or by using the keyword search tool below to find specific information within the annual report.-
 1
1 -
2
-
3
-
4
-
5
-
6
-
7
-
8
-
9
-
10
-
11
-
12
-
13
-
14
-
15
-
16
-
17
-
18
-
19
-
20
-
21
-
22
-
23
-
24
-
25
-
26
-
27
-
28
-
29
-
30
-
31
-
32
-
33
-
34
-
35
-
36
-
37
-
38
-
39
-
40
-
41
-
42
-
43
-
44
-
45
-
46
-
47
-
48
-
49
-
50
-
51
-
52
-
53
-
54
-
55
-
56
-
57
-
58
-
59
-
60
-
61
-
62
-
63
-
64
-
65
-
66
-
67
-
68
-
69
-
70
-
 71
71 -
 72
72 -
 73
73 -
 74
74 -
 75
75 -
 76
76 -
 77
77 -
 78
78 -
 79
79 -
 80
80 -
 81
81 -
 82
82 -
 83
83 -
 84
84 -
 85
85 -
 86
86 -
 87
87 -
 88
88 -
 89
89 -
 90
90 -
 91
91 -
92
-
93
-
94
-
95
-
96
-
97
-
98
-
99
-
100
-
101
-
102
-
103
-
104
-
105
-
106
-
107
-
108
-
109
-
110
-
111
-
112
-
113
-
114
-
115
-
116
-
117
-
118
-
119
-
120
-
121
-
122
-
123
-
124
 |
 |

79
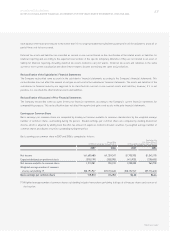
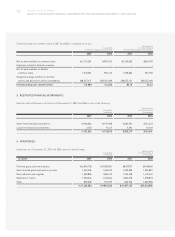
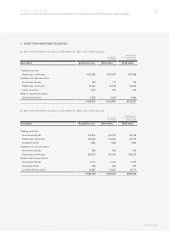
HYUNDAI MOTOR COMPANY
NOTES TO CONSOLIDATED FINANCIAL STATEMENTS FOR THE YEARS ENDED DECEMBER 31, 2007 AND 2006
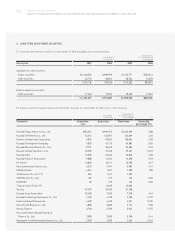
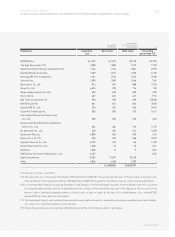
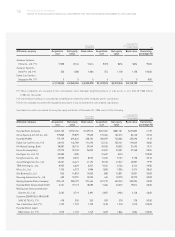
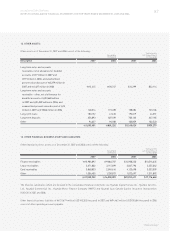
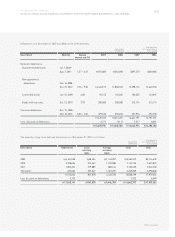
Affiliated company Acquisition Net equity Book value Acquisition Net equity Book value Ownership
cost value cost value percentage (*2)
Autoever Systems
China Co., Ltd. (*1) 80 42 42 $85 $45 $45 90.00
Autoever Systems
India Pvt. Ltd. (*1) 50 572 572 53 610 610 100.00
Eukor Car Carriers
Singapore Pte. (*1) 5 5 5 5 5 5 20.00
Hyundai Electronics (Tianjin)
Co., Ltd. (*1) 3,972 3,452 3,452 4,234 3,679 3,679 100.00
Rotem USA Corporation (*1) 3,357 2,500 2,500 3,579 2,665 2,665 100.00
Hysco Steel India, Ltd. (*1) 2,517 2,517 2,517 2,684 2,683 2,683 100.00
Rotem Equipments
(Beijing) Co., Ltd. (*1) 190 153 153 204 163 163 100.00
1,005,679 2,226,797 1,578,401 $1,071,924 $2,373,478 $1,682,372
(*1) These companies are excluded in the consolidation since individual beginning balance of total assets is less than 7,000 million
(US$7,461 thousand).
(*2) Ownership percentage is calculated by combining the ownership of the Company and its subsidiaries.
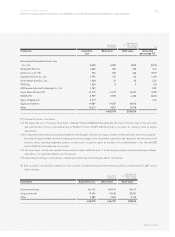
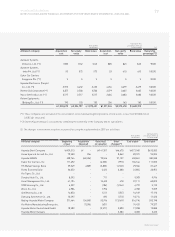
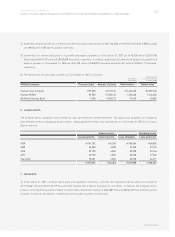
(2) The changes in investment securities accounted for using the equity method in 2007 are as follows:
(%)
Translation into
U.S. Dollars (Note 2)
(In thousands)
Korean Won
(In millions)
Translation into
U.S. Dollars (Note 2)
(In thousands)
Korean Won
(In millions)
Affiliated company Beginning Acquisition Gain (loss) Other End of year End of year
of year (disposal) on valuation changes (*)
Hyundai Steel Company 429,513 -141,357 6,670 577,540 $615,583
Korea Space & Aircraft Co., Ltd. 79,503 956 - 8,862 89,321 95,205
Hyundai MOBIS 408,764 (65,596) 70,546 37,127 450,841 480,538
Eukor Car Carriers, Inc. 111,692 - (6,535) (993) 104,164 111,025
HK Mutual Savings Bank 29,549 6,889 (5,832) (1,102) 29,504 31,447
Korea Economy Daily 26,052 - 2,422 3,380 31,854 33,952
Kia Tigers Co., Ltd. - - - - - -
Donghui Auto Co., Ltd. 8,592 - 711 - 9,303 9,916
Asset Management Co., Ltd. 41,194 - 15,439 478 57,111 60,873
TRW Steering Co., Ltd. 6,327 - (186) (1,344) 4,797 5,113
Wisco Co., Ltd. 4,986 - 1,796 - 6,782 7,229
Iljin Bearing Co., Ltd. 14,853 - 1,511 (255) 16,109 17,170
Daesung Automotive Co., Ltd. 10,295 - 692 (273) 10,714 11,420
Beijing-Hyundai Motor Company 371,464 106,985 50,916 (13,169) 516,196 550,198
Kia Motors Manufacturing Georgia Inc. - 75,056 (631) - 74,425 79,327
Hyundai Motor Deutschland GmbH 18,589 - (3,571) 2,890 17,908 19,088
Hyundai Motor Hungary - - - 2,283 2,283 2,433