Hyundai 2007 Annual Report Download - page 118
Download and view the complete annual report
Please find page 118 of the 2007 Hyundai annual report below. You can navigate through the pages in the report by either clicking on the pages listed below, or by using the keyword search tool below to find specific information within the annual report.-
 1
1 -
2
-
3
-
4
-
5
-
6
-
7
-
8
-
9
-
10
-
11
-
12
-
13
-
14
-
15
-
16
-
17
-
18
-
19
-
20
-
21
-
22
-
23
-
24
-
25
-
26
-
27
-
28
-
29
-
30
-
31
-
32
-
33
-
34
-
35
-
36
-
37
-
38
-
39
-
40
-
41
-
42
-
43
-
44
-
45
-
46
-
47
-
48
-
49
-
50
-
51
-
52
-
53
-
54
-
55
-
56
-
57
-
58
-
59
-
60
-
61
-
62
-
63
-
64
-
65
-
66
-
67
-
68
-
69
-
70
-
71
-
72
-
73
-
74
-
75
-
76
-
77
-
78
-
79
-
80
-
81
-
82
-
83
-
84
-
85
-
86
-
87
-
88
-
89
-
90
-
91
-
92
-
93
-
94
-
95
-
96
-
97
-
98
-
99
-
100
-
101
-
102
-
103
-
104
-
105
-
106
-
107
-
 108
108 -
 109
109 -
 110
110 -
 111
111 -
 112
112 -
 113
113 -
 114
114 -
 115
115 -
 116
116 -
 117
117 -
 118
118 -
 119
119 -
 120
120 -
 121
121 -
 122
122 -
 123
123 -
 124
124
 |
 |

116 HYUNDAI MOTOR COMPANY
NOTES TO CONSOLIDATED FINANCIAL STATEMENTS FOR THE YEARS ENDED DECEMBER 31, 2007 AND 2006
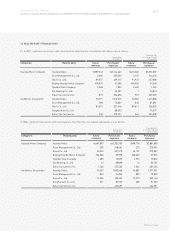
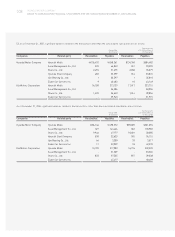
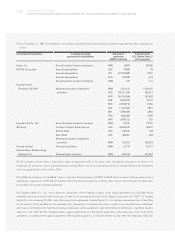
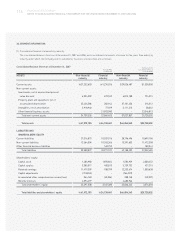
30.SEGMENT INFORMATION:
(1) Consolidated financial statements by industry
The consolidated balance sheets as of December 31, 2007 and 2006, and consolidated statements of income for the years then ended, by
industry under which the Company and its subsidiaries’ business are classified, are as follows:
Consolidated Balance Sheets as of December 31, 2007
Korean Won
(In millions)
Translation into
U.S. Dollars (Note 2)
(In thousands)
ASSETS Non-financial Financial Non-financial Financial
industry industry industry industry
Current assets: 27,232,650 1,274,076 $29,026,487 $1,358,000
Non-current assets:
Investments, net of unamortized present
value discount 6,394,009 679,552 6,815,188 724,315
Property, plant and equipment, net of
accumulated depreciation 25,426,586 202,944 27,101,456 216,312
Intangibles, net of amortization 2,918,940 77,929 3,111,213 83,062
Other financial business assets - 21,903,980 - 23,346,813
Total non-current assets 34,739,535 22,864,405 37,027,857 25,728,502
Total assets 61,972,185 24,138,481 $66,054,343 $25,728,502
LIABILITIES AND
SHAREHOLDERS’ EQUITY
Current liabilities 27,016,873 10,037,976 28,796,496 10,699,186
Non-current liabilities 12,564,004 10,763,366 13,391,605 11,472,358
Other financial business liabilities - 169,759 - 180,941
Total liabilities 39,580,877 20,971,101 42,188,102 22,352,485
Shareholders’ equity:
Capital stock 1,486,980 1,876,824 1,584,929 2,000,452
Capital surplus 5,385,017 400,813 5,739,732 427,215
Retained earnings 11,479,509 938,799 12,235,674 1,000,638
Capital adjustments (718,855) - (766,207) -
Accumulated other comprehensive income (loss) 364,160 (49,056) 388,148 (52,287)
Minority interests 4,394,497 - 4,683,966 -
Total shareholders’ equity 22,391,308 3,167,380 23,866,242 3,376,018
Total liabilities and shareholders’ equity 61,972,185 24,138,481 $66,054,343 $25,728,502