Hyundai 2007 Annual Report Download - page 58
Download and view the complete annual report
Please find page 58 of the 2007 Hyundai annual report below. You can navigate through the pages in the report by either clicking on the pages listed below, or by using the keyword search tool below to find specific information within the annual report.-
 1
1 -
2
-
3
-
4
-
5
-
6
-
7
-
8
-
9
-
10
-
11
-
12
-
13
-
14
-
15
-
16
-
17
-
18
-
19
-
20
-
21
-
22
-
23
-
24
-
25
-
26
-
27
-
28
-
29
-
30
-
31
-
32
-
33
-
34
-
35
-
36
-
37
-
38
-
39
-
40
-
41
-
42
-
43
-
44
-
45
-
46
-
47
-
 48
48 -
 49
49 -
 50
50 -
 51
51 -
 52
52 -
 53
53 -
 54
54 -
 55
55 -
 56
56 -
 57
57 -
 58
58 -
 59
59 -
 60
60 -
 61
61 -
 62
62 -
 63
63 -
 64
64 -
 65
65 -
 66
66 -
 67
67 -
 68
68 -
69
-
70
-
71
-
72
-
73
-
74
-
75
-
76
-
77
-
78
-
79
-
80
-
81
-
82
-
83
-
84
-
85
-
86
-
87
-
88
-
89
-
90
-
91
-
92
-
93
-
94
-
95
-
96
-
97
-
98
-
99
-
100
-
101
-
102
-
103
-
104
-
105
-
106
-
107
-
108
-
109
-
110
-
111
-
112
-
113
-
114
-
115
-
116
-
117
-
118
-
119
-
120
-
121
-
122
-
123
-
124
 |
 |

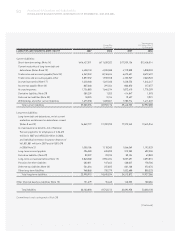
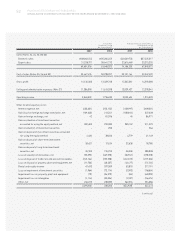
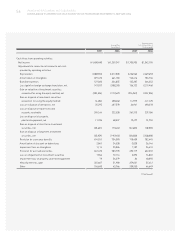
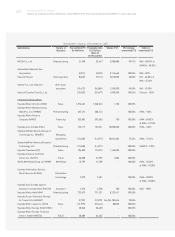
56 HYUNDAI MOTOR COMPANY AND SUBSIDIARIES
CONSOLIDATED STATEMENTS OF CASH FLOWS FOR THE YEARS ENDED DECEMBER 31, 2007 AND 2006
2007 2006 2007 2006
Cash flows from operating activities:
Net income 1,600,480 1,259,247 $1,705,905 $1,342,195
Adjustments to reconcile net income to net cash
provided by operating activities:
Depreciation 2,088,960 2,317,028 2,226,562 2,469,653
Amortization of intangibles 697,473 661,183 743,416 704,736
Bad debt expenses 127,020 324,855 135,387 346,253
Loss (gain) on foreign exchange translation, net 147,037 (208,230) 156,722 (221,946)
Gain on valuation of investment securities
accounted for using the equity method, net (203,536) (191,567) (216,943) (204,186)
Gain on disposal of investment securities
accounted for using the equity method (4,484) (38,606) (4,779) (41,149)
Loss on valuation of derivatives, net 25,295 467,578 26,961 498,378
Loss on disposal of trade notes and
accounts receivable 245,164 222,528 261,313 237,186
Loss on disposal of property,
plant and equipment, net 11,706 48,537 12,477 51,734
Gain on disposal of short-term investment
securities, net (30,621) (17,624) (32,638) (18,785)
Gain on disposal of long-term investment
securities, net (35,959) (195,922) (38,328) (208,828)
Provision for severance benefits 674,011 734,090 718,409 782,445
Amortization of discount on debentures 2,841 24,528 3,028 26,144
Impairment loss on intangibles 1,114 25,026 1,187 26,674
Provision for accrued warranties 647,470 583,778 690,119 622,232
Loss on impairment of investment securities 1,964 72,114 2,093 76,865
Impairment loss on property, plant and equipment 79 56,379 84 60,093
Minority interests, gain 355,607 51,988 379,031 55,412
Other 196,600 43,766 209,550 46,649
(Continued)
Korean Won
(In millions)
Translation into
U.S. Dollars (Note 2)
(In thousands)