Hyundai 2007 Annual Report Download - page 51
Download and view the complete annual report
Please find page 51 of the 2007 Hyundai annual report below. You can navigate through the pages in the report by either clicking on the pages listed below, or by using the keyword search tool below to find specific information within the annual report.-
 1
1 -
2
-
3
-
4
-
5
-
6
-
7
-
8
-
9
-
10
-
11
-
12
-
13
-
14
-
15
-
16
-
17
-
18
-
19
-
20
-
21
-
22
-
23
-
24
-
25
-
26
-
27
-
28
-
29
-
30
-
31
-
32
-
33
-
34
-
35
-
36
-
37
-
38
-
39
-
40
-
 41
41 -
 42
42 -
 43
43 -
 44
44 -
 45
45 -
 46
46 -
 47
47 -
 48
48 -
 49
49 -
 50
50 -
 51
51 -
 52
52 -
 53
53 -
 54
54 -
 55
55 -
 56
56 -
 57
57 -
 58
58 -
 59
59 -
 60
60 -
 61
61 -
62
-
63
-
64
-
65
-
66
-
67
-
68
-
69
-
70
-
71
-
72
-
73
-
74
-
75
-
76
-
77
-
78
-
79
-
80
-
81
-
82
-
83
-
84
-
85
-
86
-
87
-
88
-
89
-
90
-
91
-
92
-
93
-
94
-
95
-
96
-
97
-
98
-
99
-
100
-
101
-
102
-
103
-
104
-
105
-
106
-
107
-
108
-
109
-
110
-
111
-
112
-
113
-
114
-
115
-
116
-
117
-
118
-
119
-
120
-
121
-
122
-
123
-
124
 |
 |

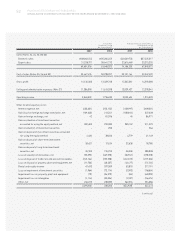
49
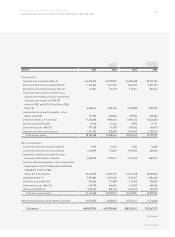
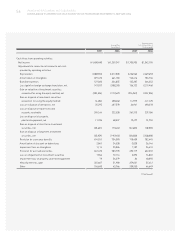
HYUNDAI MOTOR COMPANY AND SUBSIDIARIES
CONSOLIDATED BALANCE SHEETS AS OF DECEMBER 31, 2007 AND 2006
ASSETS 2007 2006 2007 2006
Current assets:
Cash and cash equivalents (Note 9) 4,393,692 3,730,007 $4,683,108 $3,975,706
Short-term financial instruments (Note 3) 3,344,206 3,144,765 3,564,492 3,351,913
Short-term investment securities (Note 5) 142,814 475,429 152,221 506,746
Trade notes and accounts receivable, less
allowance for doubtful accounts and present
value discount account of 202,492
million in 2007 and 201,154 million in 2006
(Note 16) 6,308,361 4,981,565 6,723,898 5,309,705
Trade notes and accounts receivable - other
(Notes 16 and 25) 177,587 422,800 189,285 450,650
Inventories (Notes 4, 9, 16 and 24) 11,265,083 9,892,245 12,007,123 10,543,855
Derivative assets (Note 29) 18,760 16,654 19,996 17,751
Deferred tax assets (Note 22) 797,520 716,700 850,053 763,910
Advances and other current assets 1,741,265 1,200,280 1,855,963 1,279,343
Total current assets 28,189,288 24,580,445 30,046,139 26,199,579
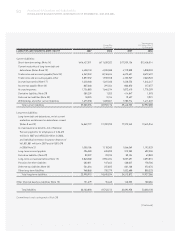
Non-current assets:
Long-term financial instruments (Note 3) 5,539 15,293 5,904 16,300
Long-term investment securities (Note 6) 1,492,399 773,007 1,590,705 823,926
Investment securities accounted for using
the equity method (Notes 7 and 16) 2,035,078 1,578,401 2,169,130 1,682,372
Property, plant and equipment, net of accumulated
depreciation of 13,277,036 million in 2007 and
8,348,614 million in 2006
(Notes 8, 9, 10,16 and 24) 25,629,530 23,491,593 27,317,768 25,039,003
Intangibles (Note 11) 2,997,884 2,612,350 3,195,357 2,784,428
Derivative assets (Note 29) 259,656 277,800 276,760 296,099
Deferred tax assets (Note 22) 610,799 440,525 651,033 469,543
Other assets (Note 12) 1,093,401 881,232 1,165,424 939,279
Total non-current assets 34,124,286 30,070,201 36,372,081 32,050,950
Other financial business assets (Notes 13 and 16) 21,533,952 16,058,839 22,952,411 17,116,648
Total assets 83,847,526 70,709,485 $89,370,631 $75,367,177
(continued)
Translation into
U.S. Dollars (Note 2)
(In thousands)
Korean Won
(In millions)