Hyundai 2007 Annual Report Download - page 72
Download and view the complete annual report
Please find page 72 of the 2007 Hyundai annual report below. You can navigate through the pages in the report by either clicking on the pages listed below, or by using the keyword search tool below to find specific information within the annual report.-
 1
1 -
2
-
3
-
4
-
5
-
6
-
7
-
8
-
9
-
10
-
11
-
12
-
13
-
14
-
15
-
16
-
17
-
18
-
19
-
20
-
21
-
22
-
23
-
24
-
25
-
26
-
27
-
28
-
29
-
30
-
31
-
32
-
33
-
34
-
35
-
36
-
37
-
38
-
39
-
40
-
41
-
42
-
43
-
44
-
45
-
46
-
47
-
48
-
49
-
50
-
51
-
52
-
53
-
54
-
55
-
56
-
57
-
58
-
59
-
60
-
61
-
 62
62 -
 63
63 -
 64
64 -
 65
65 -
 66
66 -
 67
67 -
 68
68 -
 69
69 -
 70
70 -
 71
71 -
 72
72 -
 73
73 -
 74
74 -
 75
75 -
 76
76 -
 77
77 -
 78
78 -
 79
79 -
 80
80 -
 81
81 -
 82
82 -
83
-
84
-
85
-
86
-
87
-
88
-
89
-
90
-
91
-
92
-
93
-
94
-
95
-
96
-
97
-
98
-
99
-
100
-
101
-
102
-
103
-
104
-
105
-
106
-
107
-
108
-
109
-
110
-
111
-
112
-
113
-
114
-
115
-
116
-
117
-
118
-
119
-
120
-
121
-
122
-
123
-
124
 |
 |

70 HYUNDAI MOTOR COMPANY
NOTES TO CONSOLIDATED FINANCIAL STATEMENTS FOR THE YEARS ENDED DECEMBER 31, 2007 AND 2006
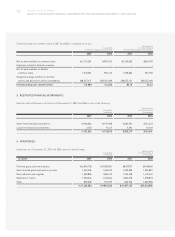
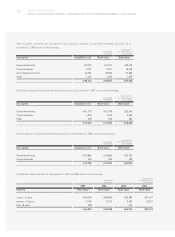
Diluted earnings per common share in 2007 and 2006 is computed as follows:
Korean Won
(In millions except per share amounts)
Translation into
U.S. Dollars (Note 2)
(In thousands except per share amounts)
2007 2006 2007 2006
Net income available to common share 1,210,281 904,152 $1,290,003 $963,709
Expenses related to diluted securities - - - -
Net income available to diluted
common share 1,210,281 904,152 1,290,003 963,709
Weighted average number of common
shares and diluted securities outstanding 208,675,471 208,567,489 208,675,471 208,567,489
Diluted earnings per common share 5,800 4,335 $6.18 $4.62
3. RESTRICTED FINANCIAL INSTRUMENTS:
Deposits with withdrawal restrictions as of December 31, 2007 and 2006 consist of the following:
Korean Won
(In millions)
Translation into
U.S. Dollars (Note 2)
(In thousands)
2007 2006 2007 2006
Short-term financial instruments: 190,384 107,398 $202,925 $114,472
Long-term financial instruments : 2,152 11,417 2,294 12,169
192,536 118,815 $205,219 $126,641
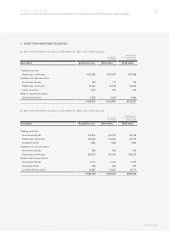
4. INVENTORIES:
Inventories as of December 31, 2007 and 2006 consist of the following:
Korean Won
(In millions)
Translation into
U.S. Dollars (Note 2)
(In thousands)
Accounts 2007 2006 2007 2006
Finished goods and merchandise 5,890,730 5,092,981 $6278757 $5428460
Semi finished goods and work in process 1,243,396 1,160,442 1,325,300 1,236,881
Raw materials and supplies 1,600,896 1,384,479 1,706,348 1,475,676
Materials in transit 1,720,676 1,312,404 1,834,018 1,398,853
Other 809,385 941,939 862,700 1,003,985
11,265,083 9,892,245 $12,007,123 $10,543,855