Hyundai 2007 Annual Report Download - page 5
Download and view the complete annual report
Please find page 5 of the 2007 Hyundai annual report below. You can navigate through the pages in the report by either clicking on the pages listed below, or by using the keyword search tool below to find specific information within the annual report.-
 1
1 -
 2
2 -
 3
3 -
 4
4 -
 5
5 -
 6
6 -
 7
7 -
 8
8 -
 9
9 -
 10
10 -
 11
11 -
 12
12 -
 13
13 -
 14
14 -
 15
15 -
 16
16 -
 17
17 -
 18
18 -
 19
19 -
 20
20 -
 21
21 -
 22
22 -
 23
23 -
 24
24 -
 25
25 -
 26
26 -
 27
27 -
 28
28 -
 29
29 -
 30
30 -
 31
31 -
 32
32 -
 33
33 -
 34
34 -
 35
35 -
 36
36 -
 37
37 -
 38
38 -
 39
39 -
 40
40 -
 41
41 -
 42
42 -
 43
43 -
 44
44 -
 45
45 -
 46
46 -
 47
47 -
 48
48 -
 49
49 -
 50
50 -
 51
51 -
 52
52 -
 53
53 -
 54
54 -
 55
55 -
 56
56 -
 57
57 -
 58
58 -
 59
59 -
 60
60 -
 61
61 -
 62
62 -
 63
63 -
 64
64 -
 65
65 -
 66
66 -
 67
67 -
 68
68 -
 69
69 -
 70
70 -
 71
71 -
 72
72 -
 73
73 -
 74
74 -
 75
75 -
 76
76 -
 77
77 -
 78
78 -
 79
79 -
 80
80 -
 81
81 -
 82
82 -
 83
83 -
 84
84 -
 85
85 -
 86
86 -
 87
87 -
 88
88 -
 89
89 -
 90
90 -
 91
91 -
 92
92 -
 93
93 -
 94
94 -
 95
95 -
 96
96 -
 97
97 -
 98
98 -
 99
99 -
 100
100 -
 101
101 -
 102
102 -
 103
103 -
 104
104 -
 105
105 -
 106
106 -
 107
107 -
 108
108 -
 109
109 -
 110
110 -
 111
111 -
 112
112 -
 113
113 -
 114
114 -
 115
115 -
 116
116 -
 117
117 -
 118
118 -
 119
119 -
 120
120 -
 121
121 -
 122
122 -
 123
123 -
 124
124
 |
 |

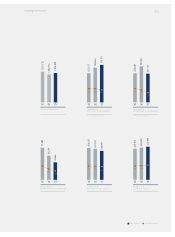
Domestic Total Export
‘05 ‘06 ‘07
1,131,122
1,030,774
1,076,070
200,150
155,157
185,641
Total Sales &
Market Share in India(HMI)*
‘05 ‘06 ‘07
*Passenger Car Segments
Total Sales &
Market Share in China(BHMC)*
*Passenger Car Segments
18.2 18.2 17%
231.137
233,668
290,011
‘05 ‘06 ‘07
7.5 7.0
4.6%
Retail Sales &
Market Share in Turkey(HAOS)
71,589
53,479
‘05 ‘06 ‘07
9.9
8.7
6.6%
Retail Sales &
Market Share in EU Countries
318,975
350,217
341,551
‘05 ‘06 ‘07
2.2 2.1 2.0%
Retail Sales &
Market Share in USA
467,009
455,012
455,520
‘05 ‘06 ‘07
2.7 2.8 2.9%
38,686
03
Challenge perceptions
Sales (Units) Market Share (%)
