Hyundai 2007 Annual Report Download - page 59
Download and view the complete annual report
Please find page 59 of the 2007 Hyundai annual report below. You can navigate through the pages in the report by either clicking on the pages listed below, or by using the keyword search tool below to find specific information within the annual report.-
 1
1 -
2
-
3
-
4
-
5
-
6
-
7
-
8
-
9
-
10
-
11
-
12
-
13
-
14
-
15
-
16
-
17
-
18
-
19
-
20
-
21
-
22
-
23
-
24
-
25
-
26
-
27
-
28
-
29
-
30
-
31
-
32
-
33
-
34
-
35
-
36
-
37
-
38
-
39
-
40
-
41
-
42
-
43
-
44
-
45
-
46
-
47
-
48
-
 49
49 -
 50
50 -
 51
51 -
 52
52 -
 53
53 -
 54
54 -
 55
55 -
 56
56 -
 57
57 -
 58
58 -
 59
59 -
 60
60 -
 61
61 -
 62
62 -
 63
63 -
 64
64 -
 65
65 -
 66
66 -
 67
67 -
 68
68 -
 69
69 -
70
-
71
-
72
-
73
-
74
-
75
-
76
-
77
-
78
-
79
-
80
-
81
-
82
-
83
-
84
-
85
-
86
-
87
-
88
-
89
-
90
-
91
-
92
-
93
-
94
-
95
-
96
-
97
-
98
-
99
-
100
-
101
-
102
-
103
-
104
-
105
-
106
-
107
-
108
-
109
-
110
-
111
-
112
-
113
-
114
-
115
-
116
-
117
-
118
-
119
-
120
-
121
-
122
-
123
-
124
 |
 |

57
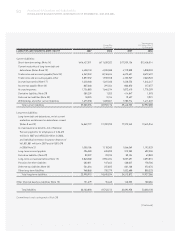
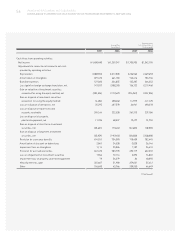
HYUNDAI MOTOR COMPANY AND SUBSIDIARIES
CONSOLIDATED STATEMENTS OF CASH FLOWS (CONTINUED)
FOR THE YEARS ENDED DECEMBER 31, 2007 AND 2006
2007 2006 2007 2006
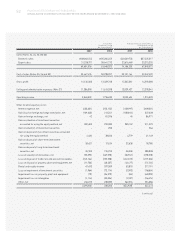
Cash flows from operating activities:
Changes in operating assets and liabilities:
Increase in trade notes and accounts receivable (1,790,422) (1,293,761) $(1,908,359) $(1,378,982)
Decrease in trade notes and
accounts receivable-other 218,426 336,090 232,814 358,229
Increase in inventories (1,562,826) (1,336,088) (1,665,771) (1,424,097)
Increase in advances and other current assets (514,360) (6,922) (548,241) (7,378)
Decrease (increase) in deferred tax assets 64,716 (60,406) 68,979 (64,385)
Increase (decrease) in trade notes and
accounts payable (1,830,077) 1,790,118 (1,950,626) 1,908,035
Increase (decrease) in accounts payable-other 1,517,663 (2,034,784) 1,617,633 (2,168,817)
Increase in income tax payable 416,104 244,671 443,513 260,788
Increase in accrued expenses 76,557 371,649 81,600 396,130
Increase in deferred tax liabilities 322,842 88,602 344,108 94,438
Increase in withholding and other current liabilities 345,176 53,974 367,913 57,529
Decrease in accrued warranties (632,476) (498,521) (674,138) (531,359)
Payment of severance benefits (805,708) (728,662) (858,781) (776,660)
Increase (decrease) in individual severance
insurance deposits (403) 41,951 (429) 44,714
Other 115,944 24,658 123,583 26,281
2,489,377 3,233,245 2,653,354 3,446,221
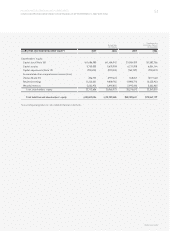
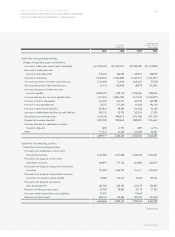
Cash flows from investing activities:
Cash inflows from investing activities:
Proceeds from withdrawal of short-term
financial instruments 5,162,383 4,911,028 5,502,433 5,234,521
Proceeds from disposal of short-term
investment securities 438,027 791,134 466,880 843,247
Proceeds from disposal of long-term investment
securities 135,580 1,366,787 144,511 1,456,818
Proceeds from disposal of investment securities
accounted for using the equity method 70,080 145,641 74,696 155,234
Proceeds from disposal of property,
plant and equipment 406,783 238,122 433,578 253,807
Reduction in other current assets 30,182 20,004 32,170 21,322
Increase in other financial business liabilities 37,217 - 39,669 -
Reduction in other assets 368,154 410,602 392,405 437,650
6,648,406 7,883,318 7,086,342 8,402,599
(Continued)
Korean Won
(In millions)
Translation into
U.S. Dollars (Note 2)
(In thousands)