Home Depot 2007 Annual Report Download - page 88
Download and view the complete annual report
Please find page 88 of the 2007 Home Depot annual report below. You can navigate through the pages in the report by either clicking on the pages listed below, or by using the keyword search tool below to find specific information within the annual report.-
 1
1 -
2
-
3
-
4
-
5
-
6
-
7
-
8
-
9
-
10
-
11
-
12
-
13
-
14
-
15
-
16
-
17
-
18
-
19
-
20
-
21
-
22
-
23
-
24
-
25
-
26
-
27
-
28
-
29
-
30
-
31
-
32
-
33
-
34
-
35
-
36
-
37
-
38
-
39
-
40
-
41
-
42
-
43
-
44
-
45
-
46
-
47
-
48
-
49
-
50
-
51
-
52
-
53
-
54
-
55
-
56
-
57
-
58
-
59
-
60
-
61
-
62
-
63
-
64
-
65
-
66
-
67
-
68
-
69
-
70
-
71
-
72
-
73
-
74
-
75
-
76
-
77
-
 78
78 -
 79
79 -
 80
80 -
 81
81 -
 82
82 -
 83
83 -
 84
84 -
 85
85 -
 86
86 -
 87
87 -
 88
88 -
 89
89 -
 90
90 -
 91
91
 |
 |

(4)
2004
2003
2002
2001
(1)
2000
1999
1998
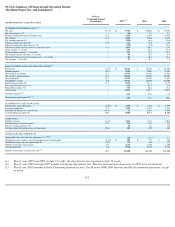
STATEMENT OF EARNINGS DATA
(2)
Net sales
$
71,100
$
63,660
$
58,247
$
53,553
$
45,738
$
38,434
$
30,219
Net sales increase (%)
11.7
9.3
8.8
17.1
19.0
27.2
25.1
Earnings before provision for income taxes
7,790
6,762
5,872
4,957
4,217
3,804
2,654
Net earnings
4,922
4,253
3,664
3,044
2,581
2,320
1,614
Net earnings increase (%)
15.7
16.1
20.4
17.9
11.3
43.7
31.9
Diluted earnings per share ($)
2.22
1.86
1.56
1.29
1.10
1.00
0.71
Diluted earnings per share increase (%)
19.4
19.2
20.9
17.3
10.0
40.8
29.1
Diluted weighted average number of common shares
2,216
2,289
2,344
2,353
2,352
2,342
2,320
Gross margin
–
%
of sales
33.4
31.7
31.1
30.2
29.9
29.7
28.5
Total operating expenses
–
%
of sales
22.4
21.1
21.1
20.9
20.7
19.8
19.7
Net interest expense (income)
–
%
of sales
—
—
(
0.1
)
—
—
—
—
Earnings before provision for income taxes
–
%
of sales
11.0
10.6
10.1
9.3
9.2
9.9
8.8
Net earnings
–
%
of sales
6.9
6.7
6.3
5.7
5.6
6.0
5.3
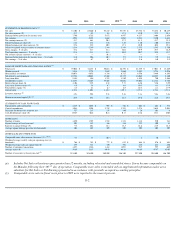
BALANCE SHEET DATA AND FINANCIAL RATIOS
(3)
Total assets
$
39,020
$
34,437
$
30,011
$
26,394
$
21,385
$
17,081
$
13,465
Working capital
3,818
3,774
3,882
3,860
3,392
2,734
2,076
Merchandise inventories
10,076
9,076
8,338
6,725
6,556
5,489
4,293
Net property and equipment
22,726
20,063
17,168
15,375
13,068
10,227
8,160
Long
-
term debt
2,148
856
1,321
1,250
1,545
750
1,566
Stockholders' equity
24,158
22,407
19,802
18,082
15,004
12,341
8,740
Book value per share ($)
11.06
9.93
8.38
7.71
6.46
5.36
3.95
Long
-
term debt
-
to
-
equity (%)
8.9
3.8
6.7
6.9
10.3
6.1
17.9
Total debt
-
to
-
equity (%)
8.9
6.1
6.7
6.9
10.3
6.1
17.9
Current ratio
1.37:1
1.40:1
1.48:1
1.59:1
1.77:1
1.75:1
1.73:1
Inventory turnover
(2)
4.9x
5.0x
5.3x
5.4x
5.1x
5.4x
5.4x
Return on invested capital (%)
(2)
19.9
19.2
18.8
18.3
19.6
22.5
19.3
STATEMENT OF CASH FLOWS DATA
Depreciation and amortization
$
1,319
$
1,076
$
903
$
764
$
601
$
463
$
373
Capital expenditures
3,948
3,508
2,749
3,393
3,574
2,618
2,094
Payments for businesses acquired, net
727
215
235
190
26
101
6
Cash dividends per share ($)
0.325
0.26
0.21
0.17
0.16
0.11
0.08
STORE DATA
Number of stores
1,890
1,707
1,532
1,333
1,134
930
761
Square footage at fiscal year
-
end
201
183
166
146
123
100
81
Increase in square footage (%)
9.8
10.2
14.1
18.5
22.6
23.5
22.8
Average square footage per store (in thousands)
106
107
108
109
108
108
107
STORE SALES AND OTHER DATA
Comparable store sales increase (decrease) (%)
(4)(5)
5.1
3.7
(0.5
)
—
4
10
7
Weighted average weekly sales per operating store (in
thousands)
$
766
$
763
$
772
$
812
$
864
$
876
$
844
Weighted average sales per square foot ($)
375
371
370
394
415
423
410
Number of customer transactions
1,295
1,246
1,161
1,091
937
797
665
Average ticket ($)
54.89
51.15
49.43
48.64
48.65
47.87
45.05
Number of associates at fiscal year
-end
(3)
323,100
298,800
280,900
256,300
227,300
201,400
156,700
Includes Net Sales at locations open greater than 12 months, including relocated and remodeled stores. Stores become comparable on
the Monday following their 365
th
day of operation. Comparable store sales is intended only as supplemental information and is not a
substitute for Net Sales or Net Earnings presented in accordance with generally accepted accounting principles.
(5)
Comparable store sales in fiscal years prior to 2002 were reported to the nearest percent.
F-2