Home Depot 2007 Annual Report Download - page 38
Download and view the complete annual report
Please find page 38 of the 2007 Home Depot annual report below. You can navigate through the pages in the report by either clicking on the pages listed below, or by using the keyword search tool below to find specific information within the annual report.-
 1
1 -
2
-
3
-
4
-
5
-
6
-
7
-
8
-
9
-
10
-
11
-
12
-
13
-
14
-
15
-
16
-
17
-
18
-
19
-
20
-
21
-
22
-
23
-
24
-
25
-
26
-
27
-
 28
28 -
 29
29 -
 30
30 -
 31
31 -
 32
32 -
 33
33 -
 34
34 -
 35
35 -
 36
36 -
 37
37 -
 38
38 -
 39
39 -
 40
40 -
 41
41 -
 42
42 -
 43
43 -
 44
44 -
 45
45 -
 46
46 -
 47
47 -
 48
48 -
49
-
50
-
51
-
52
-
53
-
54
-
55
-
56
-
57
-
58
-
59
-
60
-
61
-
62
-
63
-
64
-
65
-
66
-
67
-
68
-
69
-
70
-
71
-
72
-
73
-
74
-
75
-
76
-
77
-
78
-
79
-
80
-
81
-
82
-
83
-
84
-
85
-
86
-
87
-
88
-
89
-
90
-
91
 |
 |

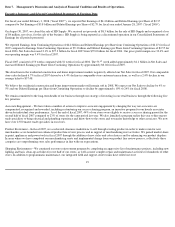
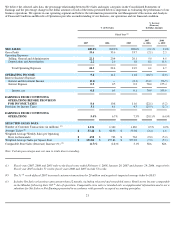
Operating Expenses
Operating Expenses increased 6.1% to $18.8 billion for fiscal 2007 from $17.7 billion for fiscal 2006. Operating Expenses as a percent of Net
Sales were 24.3% for fiscal 2007 compared to 22.4% for fiscal 2006.
Selling, General and Administrative expenses ("SG&A") increased 5.9% to $17.1 billion for fiscal 2007 from $16.1 billion for fiscal 2006. As a
percent of Net Sales, SG&A was 22.1% for fiscal 2007 compared to 20.4% for fiscal 2006. Our deleverage in SG&A reflects the impact of
negative comparable store sales, where for every one percentage point of negative comparable store sales, we expect to deleverage expenses by
about 20 basis points. Additionally in fiscal 2007, our profit sharing with the third-party administrator of the private label credit card portfolio
was $275 million less than what we received in fiscal 2006. We account for profit sharing as a reduction in operating expense. We also
recognized $88 million of write-offs associated with certain future store locations that we determined we will not open and $34 million of
expense associated with closing our 11 Home Depot Landscape Supply stores and our Tampa Call Center in fiscal 2007. SG&A also reflects
investments we are making in support of our five key priorities. As a percentage of Net Sales, total payroll increased by 76 basis points for fiscal
2007 over the same period last year. This reflects investments in store labor and our Master Trade Specialists program, the impact of our success
sharing bonus plans, as well as the negative sales environment. The increase in SG&A for fiscal 2007 over fiscal 2006 was partially offset by
$129 million of executive severance recorded in fiscal 2006.
Depreciation and Amortization increased 8.1% to $1.7 billion for fiscal 2007 from $1.6 billion for fiscal 2006. Depreciation and Amortization as
a percent of Net Sales was 2.2% for fiscal 2007 and 2.0% for fiscal 2006. The increase as a percent of Net Sales was primarily due to the
depreciation of our investments in store modernization and technology.
Operating Income
Operating Income decreased 18.3% to $7.2 billion for fiscal 2007 from $8.9 billion for fiscal 2006. Operating Income as a percent of Net Sales
was 9.4% for fiscal 2007 compared to 11.2% for fiscal 2006.
Interest, net
In fiscal 2007, we recognized $622 million of net Interest Expense compared to $364 million in fiscal 2006. Net Interest Expense as a percent of
Net Sales was 0.8% for fiscal 2007 compared to 0.5% for fiscal 2006. The increase was primarily due to additional interest incurred related to
the December 2006 issuance of $750 million of floating rate Senior Notes, $1.25 billion of 5.25% Senior Notes and $3.0 billion of 5.875%
Senior Notes.
Provision for Income Taxes
Our combined federal and state effective income tax rate for continuing operations decreased to 36.4% for fiscal 2007 from 38.1% for fiscal
2006. The decrease in our effective income tax rate for fiscal 2007 reflects the impact of a one-time retroactive tax assessment received from the
Canadian province of Quebec in the second quarter of fiscal 2006 and tax benefits recognized upon settlement of several state audits and
completion of the fiscal 2003 and 2004 federal tax audits in fiscal 2007.
Diluted Earnings per Share from Continuing Operations
Diluted Earnings per Share from Continuing Operations were $2.27 for fiscal 2007 and $2.55 for fiscal 2006. The 53
rd
week increased Diluted
Earnings per Share from Continuing Operations by approximately $0.04 for fiscal 2007. Diluted Earnings per Share from Continuing Operations
were
23