Home Depot 2007 Annual Report Download - page 53
Download and view the complete annual report
Please find page 53 of the 2007 Home Depot annual report below. You can navigate through the pages in the report by either clicking on the pages listed below, or by using the keyword search tool below to find specific information within the annual report.-
 1
1 -
2
-
3
-
4
-
5
-
6
-
7
-
8
-
9
-
10
-
11
-
12
-
13
-
14
-
15
-
16
-
17
-
18
-
19
-
20
-
21
-
22
-
23
-
24
-
25
-
26
-
27
-
28
-
29
-
30
-
31
-
32
-
33
-
34
-
35
-
36
-
37
-
38
-
39
-
40
-
41
-
42
-
 43
43 -
 44
44 -
 45
45 -
 46
46 -
 47
47 -
 48
48 -
 49
49 -
 50
50 -
 51
51 -
 52
52 -
 53
53 -
 54
54 -
 55
55 -
 56
56 -
 57
57 -
 58
58 -
 59
59 -
 60
60 -
 61
61 -
 62
62 -
 63
63 -
64
-
65
-
66
-
67
-
68
-
69
-
70
-
71
-
72
-
73
-
74
-
75
-
76
-
77
-
78
-
79
-
80
-
81
-
82
-
83
-
84
-
85
-
86
-
87
-
88
-
89
-
90
-
91
 |
 |
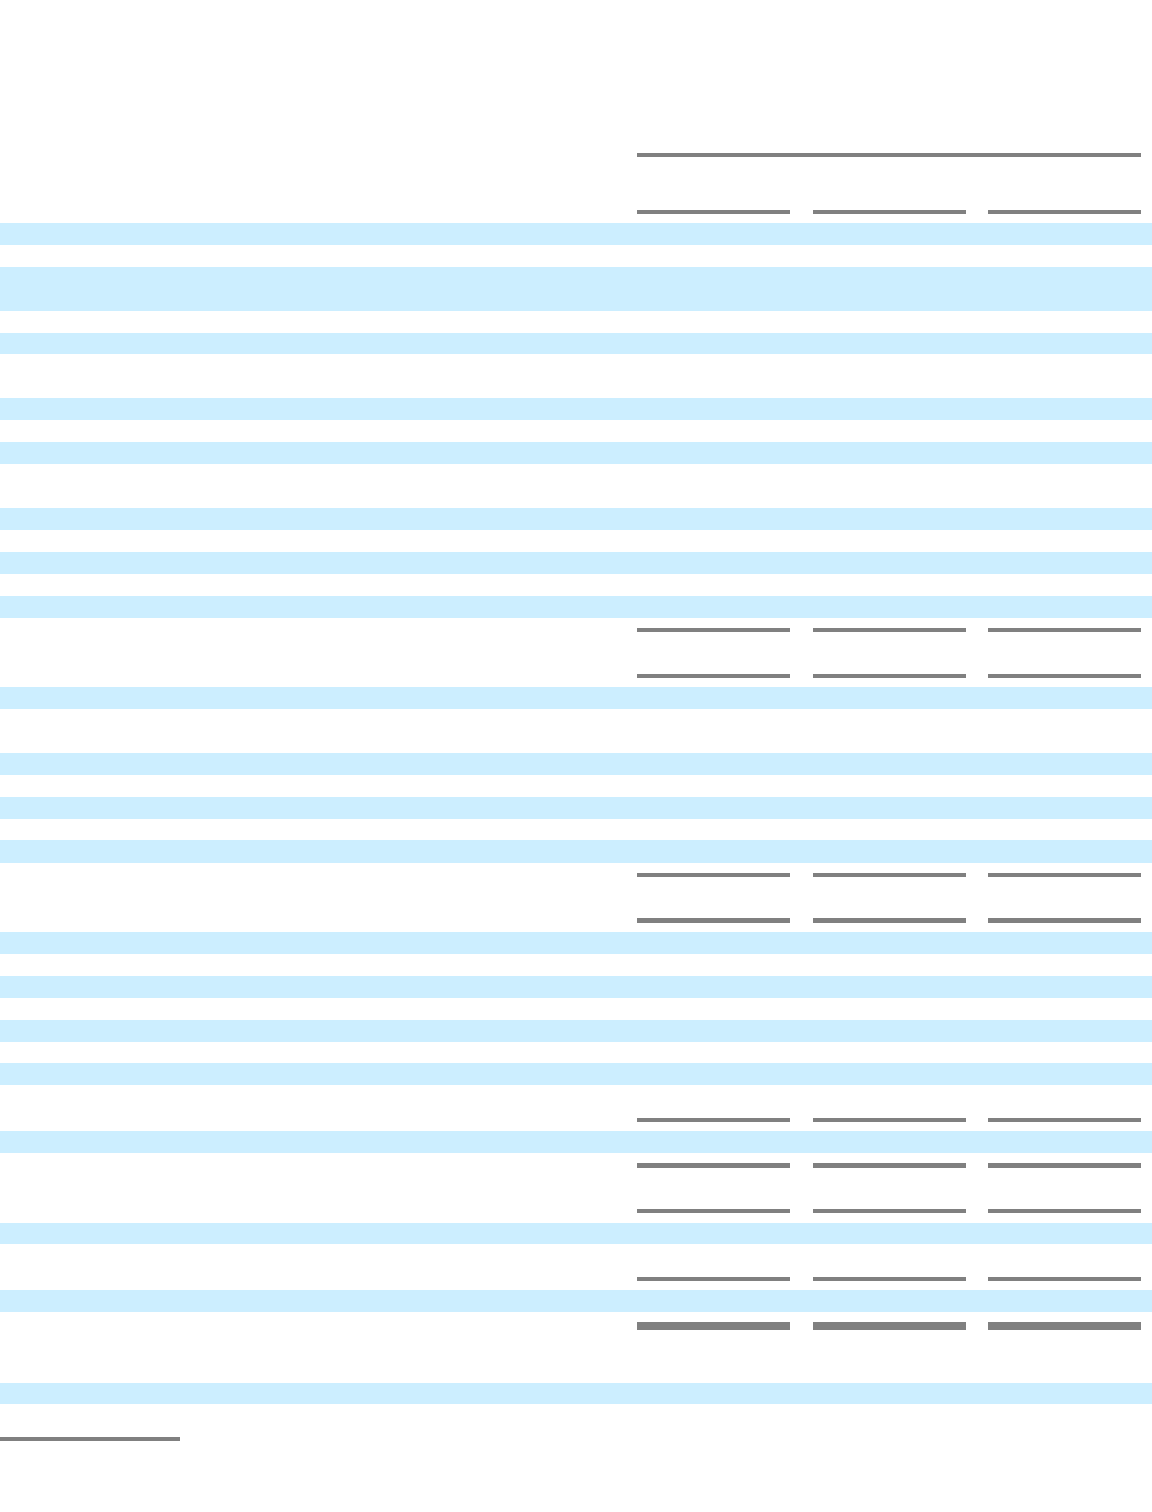
THE HOME DEPOT, INC. AND SUBSIDIARIES
CONSOLIDATED STATEMENTS OF CASH FLOWS
(1)
Fiscal Year Ended
(1)
amounts in millions
February 3,
2008
January 28,
2007
January 29,
2006
CASH FLOWS FROM OPERATING ACTIVITIES:
Net Earnings
$
4,395
$
5,761
$
5,838
Reconciliation of Net Earnings to Net Cash Provided by Operating
Activities:
Depreciation and Amortization
1,906
1,886
1,579
Stock
-
Based Compensation Expense
207
297
175
Changes in Assets and Liabilities, net of the effects of
acquisitions and disposition:
Decrease (Increase) in Receivables, net
116
96
(358
)
Increase in Merchandise Inventories
(491
)
(563
)
(971
)
Decrease (Increase) in Other Current Assets
109
(225
)
16
(Decrease) Increase in Accounts Payable and Accrued
Liabilities
(465
)
531
148
(Decrease) Increase in Deferred Revenue
(159
)
(123
)
209
(Decrease) Increase in Income Taxes Payable
—
(
172
)
175
(Decrease) Increase in Deferred Income Taxes
(348
)
46
(609
)
Increase (Decrease) in Other Long
-
Term Liabilities
186
(51
)
151
Other
271
178
267
Net Cash Provided by Operating Activities
5,727
7,661
6,620
CASH FLOWS FROM INVESTING ACTIVITIES:
Capital Expenditures, net of $19, $49 and $51 of non-cash capital
expenditures in fiscal 2007, 2006 and 2005, respectively
(3,558
)
(3,542
)
(3,881
)
Proceeds from Sale of Business, net
8,337
—
—
Payments for Businesses Acquired, net
(13
)
(4,268
)
(2,546
)
Proceeds from Sales of Property and Equipment
318
138
164
Purchases of Investments
(11,225
)
(5,409
)
(18,230
)
Proceeds from Sales and Maturities of Investments
10,899
5,434
19,907
Net Cash Provided by (Used in) Investing Activities
4,758
(7,647
)
(4,586
)
CASH FLOWS FROM FINANCING ACTIVITIES:
Proceeds from (Repayments of) Short
-
Term Borrowings, net
1,734
(900
)
900
Proceeds from Long
-
Term Borrowings, net of discount
—
8,935
995
Repayments of Long
-
Term Debt
(20
)
(509
)
(24
)
Repurchases of Common Stock
(10,815
)
(6,684
)
(3,040
)
Proceeds from Sale of Common Stock
276
381
414
Cash Dividends Paid to Stockholders
(1,709
)
(1,395
)
(857
)
Other Financing Activities
(105
)
(31
)
(136
)
Net Cash Used in Financing Activities
(10,639
)
(203
)
(1,748
)
(Decrease) Increase in Cash and Cash Equivalents
(154
)
(189
)
286
Effect of Exchange Rate Changes on Cash and Cash Equivalents
(1
)
(4
)
1
Cash and Cash Equivalents at Beginning of Year
600
793
506
Cash and Cash Equivalents at End of Year
$
445
$
600
$
793
SUPPLEMENTAL DISCLOSURE OF CASH PAYMENTS
MADE FOR:
Interest, net of interest capitalized
$
672
$
270
$
114
Income Taxes
$
2,524
$
3,963
$
3,860
Fiscal year ended February 3, 2008 includes 53 weeks. Fiscal years ended January 28, 2007 and January 29, 2006 include 52 weeks.