Home Depot 2007 Annual Report Download - page 39
Download and view the complete annual report
Please find page 39 of the 2007 Home Depot annual report below. You can navigate through the pages in the report by either clicking on the pages listed below, or by using the keyword search tool below to find specific information within the annual report.-
 1
1 -
2
-
3
-
4
-
5
-
6
-
7
-
8
-
9
-
10
-
11
-
12
-
13
-
14
-
15
-
16
-
17
-
18
-
19
-
20
-
21
-
22
-
23
-
24
-
25
-
26
-
27
-
28
-
 29
29 -
 30
30 -
 31
31 -
 32
32 -
 33
33 -
 34
34 -
 35
35 -
 36
36 -
 37
37 -
 38
38 -
 39
39 -
 40
40 -
 41
41 -
 42
42 -
 43
43 -
 44
44 -
 45
45 -
 46
46 -
 47
47 -
 48
48 -
 49
49 -
50
-
51
-
52
-
53
-
54
-
55
-
56
-
57
-
58
-
59
-
60
-
61
-
62
-
63
-
64
-
65
-
66
-
67
-
68
-
69
-
70
-
71
-
72
-
73
-
74
-
75
-
76
-
77
-
78
-
79
-
80
-
81
-
82
-
83
-
84
-
85
-
86
-
87
-
88
-
89
-
90
-
91
 |
 |

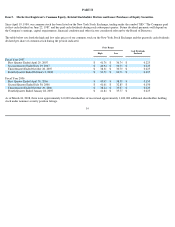
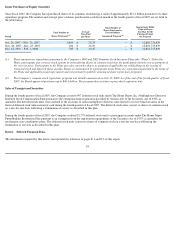
favorably impacted in both fiscal 2007 and 2006 by the repurchase of shares of our common stock under our $40.0 billion repurchase
authorization. We repurchased 293 million shares for $10.8 billion in fiscal 2007 and 174 million shares for $6.7 billion in fiscal 2006. Since the
inception of the program in 2002, we have repurchased 743 million shares of our common stock for a total of $27.2 billion. As of February 3,
2008, we had $12.8 billion remaining under our authorized share repurchase program.
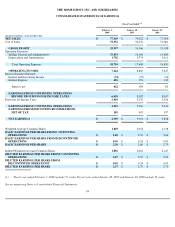
Discontinued Operations
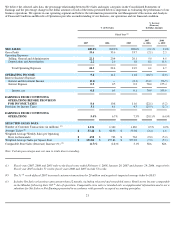
Discontinued operations consist of the results of operations through August 30, 2007 and a loss on the sale of HD Supply. Net Sales from
discontinued operations were $7.4 billion for fiscal 2007 compared to $11.8 billion for fiscal 2006. Earnings from Discontinued Operations, net
of tax, were $185 million for fiscal 2007, compared to $495 million for last year. Earnings from Discontinued Operations for fiscal 2007 include
a $4 million loss, net of tax, recognized on the sale of the business.
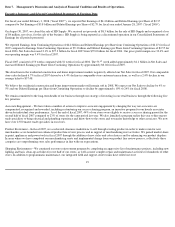
Fiscal 2006 Compared to Fiscal Year Ended January 29, 2006 ("fiscal 2005")
Net Sales
Net Sales for fiscal 2006 increased 2.6%, or $2.0 billion, to $79.0 billion from $77.0 billion for fiscal 2005. Fiscal 2006 Net Sales growth was
primarily driven by Net Sales of $4.0 billion from new stores. Comparable store sales decreased 2.8% for fiscal 2006 compared to an increase of
3.1% for fiscal 2005. The decline in comparable store sales was driven by a 4.6% decline in comparable store customer transactions offset in part
by a 1.6% increase in average ticket. Our average ticket increased to $58.90 for fiscal 2006 and increased in 8 of 10 selling departments. The
decrease in comparable store sales for fiscal 2006 was due to the significant slowdown in the U.S. retail home improvement market as well as
difficult year-over-year comparisons due to sales arising from hurricane activity in fiscal 2005. Both Canada and Mexico experienced positive
comparable store sales for fiscal 2006. Additionally, our comparable store sales results reflect in part the impact of cannibalization. Our new
stores cannibalized approximately 14% of our existing stores during fiscal 2006, which had a negative impact to comparable store sales of
approximately 2%.
Gross Profit
Gross Profit increased 2.3% to $26.5 billion for fiscal 2006 from $25.9 billion for fiscal 2005. Gross Profit as a percent of Net Sales decreased 9
basis points to 33.6% for fiscal 2006 compared to 33.7% for fiscal 2005. The decline in Gross Profit as a percent of Net Sales reflects a changing
mix of products sold primarily due to growth in appliances whose margin rate is below the Company average.
Operating Expenses
Operating Expenses increased 4.7% to $17.7 billion for fiscal 2006 from $16.9 billion for fiscal 2005. Operating Expenses as a percent of Net
Sales were 22.4% for fiscal 2006 compared to 21.9% for fiscal 2005.
SG&A increased 4.0% to $16.1 billion for fiscal 2006 from $15.5 billion for fiscal 2005. As a percent of Net Sales, SG&A was 20.4% for fiscal
2006 and 20.1% for fiscal 2005. The increase in SG&A during fiscal 2006 was due to added associate labor hours on the floor of our stores,
increased spending on store maintenance programs and the expansion of merchandise display resets. This increase was partially offset by
reduced self-insurance costs as we continue to realize benefits from safety programs and other initiatives. Also in fiscal 2006, we received more
benefits under our profit sharing provision with the third-party administrator of the private label credit card portfolio than in fiscal 2005.
Also impacting our SG&A in fiscal 2006 was expense associated with executive severance of $129 million and the adoption of Statement of
Financial Accounting Standards ("SFAS") No. 123(R),
24