Home Depot 2007 Annual Report Download - page 87
Download and view the complete annual report
Please find page 87 of the 2007 Home Depot annual report below. You can navigate through the pages in the report by either clicking on the pages listed below, or by using the keyword search tool below to find specific information within the annual report.-
 1
1 -
2
-
3
-
4
-
5
-
6
-
7
-
8
-
9
-
10
-
11
-
12
-
13
-
14
-
15
-
16
-
17
-
18
-
19
-
20
-
21
-
22
-
23
-
24
-
25
-
26
-
27
-
28
-
29
-
30
-
31
-
32
-
33
-
34
-
35
-
36
-
37
-
38
-
39
-
40
-
41
-
42
-
43
-
44
-
45
-
46
-
47
-
48
-
49
-
50
-
51
-
52
-
53
-
54
-
55
-
56
-
57
-
58
-
59
-
60
-
61
-
62
-
63
-
64
-
65
-
66
-
67
-
68
-
69
-
70
-
71
-
72
-
73
-
74
-
75
-
76
-
 77
77 -
 78
78 -
 79
79 -
 80
80 -
 81
81 -
 82
82 -
 83
83 -
 84
84 -
 85
85 -
 86
86 -
 87
87 -
 88
88 -
 89
89 -
 90
90 -
 91
91
 |
 |

10
-
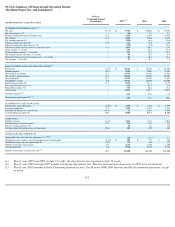
Year Summary of Financial and Operating Results
The Home Depot, Inc. and Subsidiaries
(1)
amounts in millions, except where noted
10-Year
Compound Annual
Growth Rate
2007
(1)
2006
2005
STATEMENT OF EARNINGS DATA
(2)
Net sales
12.3
%
$
77,349
$
79,022
$
77,019
Net sales increase (%)
—
(
2.1
)
2.6
8.3
Earnings before provision for income taxes
13.3
6,620
8,502
8,967
Net earnings
13.8
4,210
5,266
5,641
Net earnings increase (%)
—
(
20.1
)
(6.6
)
14.6
Diluted earnings per share ($)
15.9
2.27
2.55
2.63
Diluted earnings per share increase (%)
—
(
11.0
)
(3.0
)
18.5
Diluted weighted average number of common shares
(2.1
)
1,856
2,062
2,147
Gross margin
–
%
of sales
—
33.6
33.6
33.7
Total operating expenses
–
%
of sales
—
24.3
22.4
21.9
Net interest expense (income)
–
%
of sales
—
0.8
0.5
0.1
Earnings before provision for income taxes
–
%
of sales
—
8.6
10.8
11.6
Net earnings
–
%
of sales
—
5.4
6.7
7.3
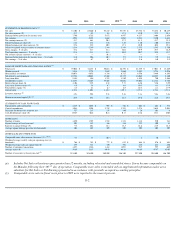
BALANCE SHEET DATA AND FINANCIAL RATIOS
(3)
Total assets
14.7
%
$
44,324
$
52,263
$
44,405
Working capital
(0.2
)
1,968
5,069
2,563
Merchandise inventories
12.5
11,731
12,822
11,401
Net property and equipment
15.5
27,476
26,605
24,901
Long
-
term debt
24.2
11,383
11,643
2,672
Stockholders' equity
9.6
17,714
25,030
26,909
Book value per share ($)
12.5
10.48
12.71
12.67
Long
-
term debt
-
to
-
equity (%)
—
64.3
46.5
9.9
Total debt
-
to
-
equity (%)
—
75.8
46.6
15.2
Current ratio
—
1.15:1
1.39:1
1.20:1
Inventory turnover
(2)
—
4.2x
4.5x
4.7x
Return on invested capital (%)
(2)
—
13.9
16.8
20.4
STATEMENT OF CASH FLOWS DATA
Depreciation and amortization
21.0
%
$
1,906
$
1,886
$
1,579
Capital expenditures
9.3
3,558
3,542
3,881
Payments for businesses acquired, net
(14.3
)
13
4,268
2,546
Cash dividends per share ($)
30.5
0.900
0.675
0.400
STORE DATA
Number of stores
13.6
%
2,234
2,147
2,042
Square footage at fiscal year
-
end
13.5
235
224
215
Increase in square footage (%)
—
4.9
4.2
7.0
Average square footage per store (in thousands)
(0.1
)
105
105
105
STORE SALES AND OTHER DATA
Comparable store sales increase (decrease) (%)
(4)(5)
—
(
6.7
)
(2.8
)
3.1
Weighted average weekly sales per operating store (in thousands)
(2.3
)%
$
658
$
723
$
763
Weighted average sales per square foot ($)
(2.0
)
332
358
377
Number of customer transactions
9.3
1,336
1,330
1,330
Average ticket ($)
2.8
57.48
58.90
57.98
Number of associates at fiscal year
-end
(3)
10.3
331,000
364,400
344,800
Fiscal years 2007 and 2001 include 53 weeks; all other fiscal years reported include 52 weeks.
(2) Fiscal years 2003 through 2007 include Continuing Operations only. The discontinued operations prior to 2003 were not material.
(3) Fiscal year 2007 amounts include Continuing Operations only. Fiscal years 1998-2006 amounts include discontinued operations, except
as noted.
F-1