Home Depot 2007 Annual Report Download - page 40
Download and view the complete annual report
Please find page 40 of the 2007 Home Depot annual report below. You can navigate through the pages in the report by either clicking on the pages listed below, or by using the keyword search tool below to find specific information within the annual report.-
 1
1 -
2
-
3
-
4
-
5
-
6
-
7
-
8
-
9
-
10
-
11
-
12
-
13
-
14
-
15
-
16
-
17
-
18
-
19
-
20
-
21
-
22
-
23
-
24
-
25
-
26
-
27
-
28
-
29
-
 30
30 -
 31
31 -
 32
32 -
 33
33 -
 34
34 -
 35
35 -
 36
36 -
 37
37 -
 38
38 -
 39
39 -
 40
40 -
 41
41 -
 42
42 -
 43
43 -
 44
44 -
 45
45 -
 46
46 -
 47
47 -
 48
48 -
 49
49 -
 50
50 -
51
-
52
-
53
-
54
-
55
-
56
-
57
-
58
-
59
-
60
-
61
-
62
-
63
-
64
-
65
-
66
-
67
-
68
-
69
-
70
-
71
-
72
-
73
-
74
-
75
-
76
-
77
-
78
-
79
-
80
-
81
-
82
-
83
-
84
-
85
-
86
-
87
-
88
-
89
-
90
-
91
 |
 |

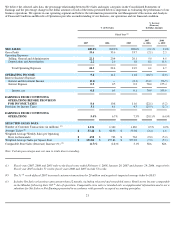
"Share-Based Payment" ("SFAS 123(R)"), whereby we recorded approximately $40 million of stock compensation expense related to the
continued vesting of options granted prior to fiscal 2003. Partially offsetting the increase in SG&A was $91 million of impairment charges and
expense related to lease obligations associated with the closing of 20 EXPO Design Center stores in fiscal 2005.
Depreciation and Amortization increased 11.6% to $1.6 billion for fiscal 2006 from $1.4 billion for fiscal 2005. Depreciation and Amortization
as a percent of Net Sales was 2.0% for fiscal 2006 and 1.8% for fiscal 2005. The increase as a percent of Net Sales was primarily due to the
depreciation of our investments in store modernization and technology.
Operating Income
Operating Income decreased 2.0% to $8.9 billion for fiscal 2006 from $9.0 billion for fiscal 2005. Operating Income as a percent of Net Sales
was 11.2% for fiscal 2006 and 11.8% for fiscal 2005.
Interest, net
In fiscal 2006, we recognized $364 million of net Interest Expense compared to $80 million in fiscal 2005. Net Interest Expense as a percent of
Net Sales was 0.5% for fiscal 2006 compared to 0.1% for fiscal 2005. The increase was primarily due to additional interest incurred related to
the March 2006 issuance of $1.0 billion of 5.20% Senior Notes and $3.0 billion of 5.40% Senior Notes and the December 2006 issuance of
$750 million of floating rate Senior Notes, $1.25 billion of 5.25% Senior Notes and $3.0 billion of 5.875% Senior Notes.
Provision for Income Taxes
Our combined federal, state and foreign effective income tax rate increased to 38.1% for fiscal 2006 from 37.1% for fiscal 2005. The increase in
our effective income tax rate for fiscal 2006 was primarily due to the impact of a retroactive tax assessment from the Canadian province of
Quebec. During the second quarter of fiscal 2006, the Quebec National Assembly passed legislation that retroactively changed certain tax laws
that subjected us to additional tax and interest. As a result, we received an assessment from Quebec for $57 million in retroactive tax and
$12 million in related interest for the 2002 through 2005 taxable years.
Diluted Earnings per Share from Continuing Operations
Diluted Earnings per Share from Continuing Operations were $2.55 for fiscal 2006 and $2.63 for fiscal 2005. Diluted Earnings per Share from
Continuing Operations were favorably impacted in both fiscal 2006 and fiscal 2005 by the repurchase of shares of our common stock.
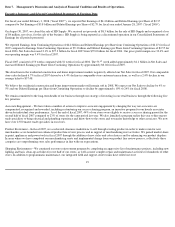
Liquidity and Capital Resources
Cash flow generated from operations provides a significant source of liquidity. For fiscal 2007, Net Cash Provided by Operating Activities was
$5.7 billion as compared to $7.7 billion for fiscal 2006. This change was primarily a result of decreased Net Earnings and changes in working
capital.
Investing activities provided $4.8 billion for fiscal 2007 compared to $7.6 billion used in investing activities for fiscal 2006. This increase was
primarily the result of $8.3 billion of net proceeds from the sale of HD Supply in the third quarter of fiscal 2007 and $4.3 billion less in
Payments for Businesses Acquired in fiscal 2007. The sale of HD Supply principally resulted in reductions in the following balance sheet
accounts: Receivables, Merchandise Inventories, Goodwill, Other Assets, Accounts Payable and Accrued Salaries and Related Expenses.
Additionally in fiscal 2007, we spent $3.6 billion on Capital Expenditures, allocated as follows: 56% for new stores, 8% for store modernization,
15% for technology and 21% for other initiatives. Of the
25