Home Depot 2007 Annual Report Download - page 37
Download and view the complete annual report
Please find page 37 of the 2007 Home Depot annual report below. You can navigate through the pages in the report by either clicking on the pages listed below, or by using the keyword search tool below to find specific information within the annual report.-
 1
1 -
2
-
3
-
4
-
5
-
6
-
7
-
8
-
9
-
10
-
11
-
12
-
13
-
14
-
15
-
16
-
17
-
18
-
19
-
20
-
21
-
22
-
23
-
24
-
25
-
26
-
 27
27 -
 28
28 -
 29
29 -
 30
30 -
 31
31 -
 32
32 -
 33
33 -
 34
34 -
 35
35 -
 36
36 -
 37
37 -
 38
38 -
 39
39 -
 40
40 -
 41
41 -
 42
42 -
 43
43 -
 44
44 -
 45
45 -
 46
46 -
 47
47 -
48
-
49
-
50
-
51
-
52
-
53
-
54
-
55
-
56
-
57
-
58
-
59
-
60
-
61
-
62
-
63
-
64
-
65
-
66
-
67
-
68
-
69
-
70
-
71
-
72
-
73
-
74
-
75
-
76
-
77
-
78
-
79
-
80
-
81
-
82
-
83
-
84
-
85
-
86
-
87
-
88
-
89
-
90
-
91
 |
 |

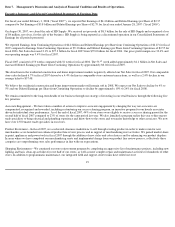
Results of Operations
For an understanding of the significant factors that influenced our performance during the past three fiscal years, the following discussion should
be read in conjunction with the Consolidated Financial Statements and the Notes to Consolidated Financial Statements presented in this report.
Fiscal 2007 Compared to Fiscal 2006
Net Sales
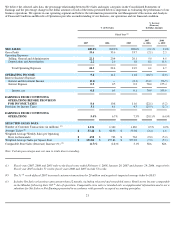
Fiscal 2007 consisted of 53 weeks compared to 52 weeks in fiscal 2006. Net Sales for fiscal 2007 decreased 2.1%, or $1.7 billion, to
$77.3 billion from $79.0 billion for fiscal 2006. The decrease in Net Sales for fiscal 2007 reflects the impact of negative comparable store sales,
partially offset by Net Sales of $3.7 billion for fiscal 2007 from new stores and $1.1 billion of Net Sales attributable to the additional week in
fiscal 2007. Comparable store sales decreased 6.7% for fiscal 2007 compared to a decrease of 2.8% for fiscal 2006.
There were a number of factors that contributed to our comparable store sales decline. The residential construction and home improvement
markets continued to be soft, especially in some of our traditionally strong markets such as Florida, California and the Northeast. We saw
relative strength in Flooring, Plumbing, Garden, and Paint as comparable store sales in these areas were above the Company average for fiscal
2007. We gained market share in power tools and equipment, due in part to our launch of Ryobi One+ lithium products in fiscal 2007.
Comparable store sales for Lumber, Building Materials, Hardware, Lighting, Kitchen/Bath and Millwork were below the Company average for
fiscal 2007. The combination of softness in our big ticket categories and commodity price deflation negatively impacted average ticket, which
decreased 2.4% to $57.48 for fiscal 2007.
Our international business performed well in fiscal 2007. Our Mexican stores posted a double digit comparable store sales increase for fiscal
2007, and Canada's comparable store sales were also positive.
In order to meet our customer service objectives, we strategically open stores near market areas served by existing stores ("cannibalize") to
enhance service levels, gain incremental sales and increase market penetration. Our new stores cannibalized approximately 10% of our existing
stores as of the end of fiscal 2007, which had a negative impact to comparable store sales of approximately 1%.
We believe that our sales performance has been, and could continue to be, negatively impacted by the level of competition that we encounter in
various markets. Due to the highly-fragmented U.S. home improvement industry, in which we estimate our market share is approximately 15%,
measuring the impact on our sales by our competitors is difficult.
Gross Profit
Gross Profit decreased 2.1% to $26.0 billion for fiscal 2007 from $26.5 billion for fiscal 2006. Gross Profit as a percent of Net Sales was 33.6%
for fiscal 2007, flat compared to fiscal 2006. Lower deferred interest costs associated with our private label credit card financing programs
provided a benefit of 39 basis points to Gross Profit as a percent of Net Sales for fiscal 2007. Through our private label credit card, we offer no
interest/no payment programs. The cost of deferred interest associated with these programs is included in Cost of Sales. For fiscal 2007, the
penetration of our private label and co-branded credit sales was 29.4% compared to 28.0% for fiscal 2006. The deferred interest benefit was
mostly offset by a higher penetration of lower margin products such as appliances and markdowns taken to clear through some seasonal items,
such as outdoor power equipment and grills, and to allow us to transition into new products, such as assembled cabinets and kitchen accessories.
22