Home Depot 2007 Annual Report Download - page 72
Download and view the complete annual report
Please find page 72 of the 2007 Home Depot annual report below. You can navigate through the pages in the report by either clicking on the pages listed below, or by using the keyword search tool below to find specific information within the annual report.-
 1
1 -
2
-
3
-
4
-
5
-
6
-
7
-
8
-
9
-
10
-
11
-
12
-
13
-
14
-
15
-
16
-
17
-
18
-
19
-
20
-
21
-
22
-
23
-
24
-
25
-
26
-
27
-
28
-
29
-
30
-
31
-
32
-
33
-
34
-
35
-
36
-
37
-
38
-
39
-
40
-
41
-
42
-
43
-
44
-
45
-
46
-
47
-
48
-
49
-
50
-
51
-
52
-
53
-
54
-
55
-
56
-
57
-
58
-
59
-
60
-
61
-
 62
62 -
 63
63 -
 64
64 -
 65
65 -
 66
66 -
 67
67 -
 68
68 -
 69
69 -
 70
70 -
 71
71 -
 72
72 -
 73
73 -
 74
74 -
 75
75 -
 76
76 -
 77
77 -
 78
78 -
 79
79 -
 80
80 -
 81
81 -
 82
82 -
83
-
84
-
85
-
86
-
87
-
88
-
89
-
90
-
91
 |
 |

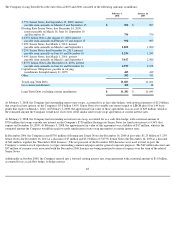
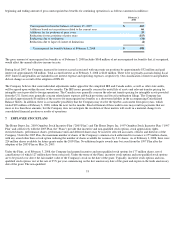
The following table summarizes stock options outstanding at February 3, 2008, January 28, 2007 and January 29, 2006, and changes during the
fiscal years ended on these dates (shares in thousands):
The total intrinsic value of stock options exercised during fiscal 2007 was $63 million.
As of February 3, 2008, there were approximately 52 million stock options outstanding with a weighted average remaining life of five years and
an intrinsic value of $30 million. As of February 3, 2008, there were approximately 42 million options exercisable with a weighted average
exercise price of $39.43 and an intrinsic value of $28 million. As of February 3, 2008, there were approximately 51 million shares vested or
expected to ultimately vest. As of February 3, 2008, there was $84 million of unamortized stock-based compensation expense related to stock
options which is expected to be recognized over a weighted average period of two years.
The following table summarizes restricted stock outstanding at February 3, 2008 (shares in thousands):
As of February 3, 2008, there was $267 million of unamortized stock-based compensation expense related to restricted stock which is expected
to be recognized over a weighted average period of three years.
55
Number of
Shares
Weighted
Average Exercise
Price
Outstanding at January 30, 2005
86,394
$
36.12
Granted
17,721
37.96
Exercised
(11,457
)
28.83
Canceled
(8,626
)
38.65
Outstanding at January 29, 2006
84,032
$
37.24
Granted
257
39.53
Exercised
(10,045
)
28.69
Canceled
(8,103
)
40.12
Outstanding at January 28, 2007
66,141
$
38.20
Granted
2,926
37.80
Exercised
(6,859
)
28.50
Canceled
(9,843
)
40.68
Outstanding at February 3, 2008
52,365
$
38.98
Number of
Shares
Weighted
Average Grant
Date Fair Value
Outstanding at January 29, 2006
5,308
$
35.76
Granted
7,575
41.37
Restrictions lapsed
(1,202
)
38.03
Canceled
(1,551
)
39.00
Outstanding at January 28, 2007
10,130
$
39.20
Granted
7,091
39.10
Restrictions lapsed
(2,662
)
39.01
Canceled
(2,844
)
39.37
Outstanding at February 3, 2008
11,715
$
39.14