Home Depot 2007 Annual Report Download - page 60
Download and view the complete annual report
Please find page 60 of the 2007 Home Depot annual report below. You can navigate through the pages in the report by either clicking on the pages listed below, or by using the keyword search tool below to find specific information within the annual report.-
 1
1 -
2
-
3
-
4
-
5
-
6
-
7
-
8
-
9
-
10
-
11
-
12
-
13
-
14
-
15
-
16
-
17
-
18
-
19
-
20
-
21
-
22
-
23
-
24
-
25
-
26
-
27
-
28
-
29
-
30
-
31
-
32
-
33
-
34
-
35
-
36
-
37
-
38
-
39
-
40
-
41
-
42
-
43
-
44
-
45
-
46
-
47
-
48
-
49
-
 50
50 -
 51
51 -
 52
52 -
 53
53 -
 54
54 -
 55
55 -
 56
56 -
 57
57 -
 58
58 -
 59
59 -
 60
60 -
 61
61 -
 62
62 -
 63
63 -
 64
64 -
 65
65 -
 66
66 -
 67
67 -
 68
68 -
 69
69 -
 70
70 -
71
-
72
-
73
-
74
-
75
-
76
-
77
-
78
-
79
-
80
-
81
-
82
-
83
-
84
-
85
-
86
-
87
-
88
-
89
-
90
-
91
 |
 |

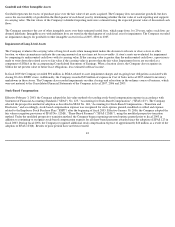
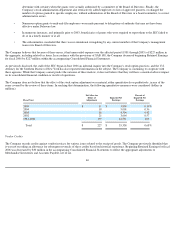
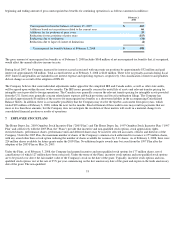
The per share weighted average fair value of stock options granted during fiscal 2007, 2006 and 2005 was $9.45, $11.88 and $12.83,
respectively. The fair value of these options was determined at the date of grant using the Black-Scholes option-
pricing model with the following
assumptions:
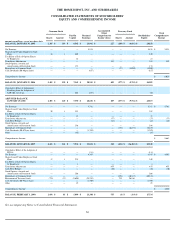
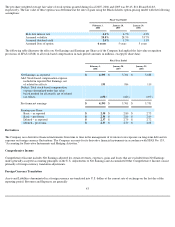
The following table illustrates the effect on Net Earnings and Earnings per Share as if the Company had applied the fair value recognition
provisions of SFAS 123(R) to all stock-based compensation in each period (amounts in millions, except per share data):
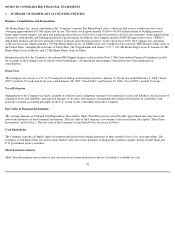
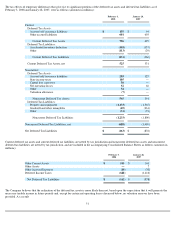
Derivatives
The Company uses derivative financial instruments from time to time in the management of its interest rate exposure on long-term debt and its
exposure on foreign currency fluctuations. The Company accounts for its derivative financial instruments in accordance with SFAS No. 133,
"Accounting for Derivative Instruments and Hedging Activities."
Comprehensive Income
Comprehensive Income includes Net Earnings adjusted for certain revenues, expenses, gains and losses that are excluded from Net Earnings
under generally accepted accounting principles in the U.S. Adjustments to Net Earnings and Accumulated Other Comprehensive Income consist
primarily of foreign currency translation adjustments.
Foreign Currency Translation
Assets and Liabilities denominated in a foreign currency are translated into U.S. dollars at the current rate of exchange on the last day of the
reporting period. Revenues and Expenses are generally
43
Fiscal Year Ended
February 3,
2008
January 28,
2007
January 29,
2006
Risk
-
free interest rate
4.4
%
4.7
%
4.3
%
Assumed volatility
25.5
%
28.5
%
33.7
%
Assumed dividend yield
2.4
%
1.5
%
1.1
%
Assumed lives of option
6 years
5 years
5 years
Fiscal Year Ended
February 3,
2008
January 28,
2007
January 29,
2006
Net Earnings, as reported
$
4,395
$
5,761
$
5,838
Add: Stock-based compensation expense
included in reported Net Earnings, net
of related tax effects
131
186
110
Deduct: Total stock-based compensation
expense determined under fair value
based method for all awards, net of related
tax effects
(131
)
(186
)
(197
)
Pro forma net earnings
$
4,395
$
5,761
$
5,751
Earnings per Share:
Basic
–
as reported
$
2.38
$
2.80
$
2.73
Basic
–
pro forma
$
2.38
$
2.80
$
2.69
Diluted
–
as reported
$
2.37
$
2.79
$
2.72
Diluted
–
pro forma
$
2.37
$
2.79
$
2.68