HTC 2004 Annual Report Download - page 39
Download and view the complete annual report
Please find page 39 of the 2004 HTC annual report below. You can navigate through the pages in the report by either clicking on the pages listed below, or by using the keyword search tool below to find specific information within the annual report.-
 1
1 -
2
-
3
-
4
-
5
-
6
-
7
-
8
-
9
-
10
-
11
-
12
-
13
-
14
-
15
-
16
-
17
-
18
-
19
-
20
-
21
-
22
-
23
-
24
-
25
-
26
-
27
-
28
-
 29
29 -
 30
30 -
 31
31 -
 32
32 -
 33
33 -
 34
34 -
 35
35 -
 36
36 -
 37
37 -
 38
38 -
 39
39 -
 40
40 -
 41
41 -
 42
42 -
 43
43 -
 44
44 -
 45
45 -
 46
46 -
 47
47 -
 48
48 -
 49
49 -
50
-
51
-
52
-
53
-
54
-
55
-
56
-
57
-
58
-
59
-
60
-
61
-
62
-
63
-
64
-
65
-
66
-
67
-
68
-
69
-
70
-
71
-
72
-
73
-
74
-
75
-
76
-
77
-
78
-
79
-
80
-
81
-
82
-
83
-
84
-
85
-
86
-
87
-
88
-
89
-
90
-
91
-
92
-
93
-
94
-
95
-
96
-
97
 |
 |

-35-
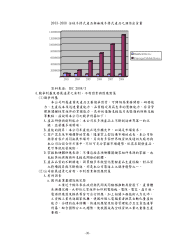
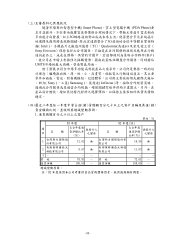
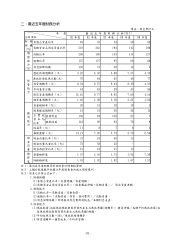
2.銷貨總額百分之十以上之客戶 單位:%
93 年度(註 2) 92 年度(註 1)
目 名稱 占全年度銷
貨淨額比率
(%)
與發行人
之關係 名稱 占全年銷貨
淨額比率
(%)
與發行人
之關係
1 HP 32.49 無 HP 57.00 無
2 T-MOBILE 11.47 無 - - -
其 他 56.04 - 其 他 43.00 -
銷貨淨額 100.00 - 銷貨淨額 100.00 -
增減變動原因:
註 1:91 及 92 年度之主要銷貨對象係因 HP 與 COMPAQ 合併,故由 COMPAQ 改為 HP
註 2:93 年度銷貨變動原因,係因 PDA(HP)銷量減少,而 SmartPhone(T-Mobile)
銷量增加所致
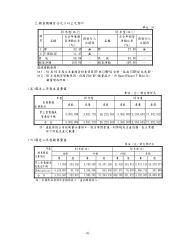
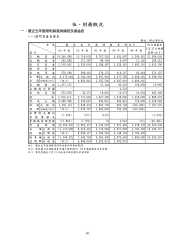
(五)最近二年度生產量值
單位:台/新台幣仟元
93 年度 92 年度 年度
生產量值
主要商品 產能 產量 產值 產能 產量 產值
掌上型電腦及
智慧型手機 4,000,000 3,831,731 26,223,363 3,500,000 2,504,635 17,532,022
合 計 4,000,000 3,831,731 26,223,363 3,500,000 2,504,635 17,532,022
註:產能係指公司經衡量必要停工假日等因素後,利用現有生產設備,在正常運
作下所能生產之數量
(六)最近二年度銷售量值 單位:台/新台幣仟元
93 年度(註) 92 年度(註)
內銷 外銷 內銷 外銷
年度
銷售量值
主要商品 量 值 量 值 量 值 量 值
掌上型電腦及
智慧型手機 17,950 205,266 3,709,389 34,507,280 32,428 245,014 2,457,135 20,270,977
其他(option) 4,533,897 81,750 3,354,396 855,965 817,371 76,907 1,866,712 597,980
合 計 4,551,847 287,016 7,063,785 35,363,245 849,799 321,921 4,323,847 20,868,957
註:主要商品資料不含維修收入產品開發收入