Frontier Airlines 2005 Annual Report Download - page 73
Download and view the complete annual report
Please find page 73 of the 2005 Frontier Airlines annual report below. You can navigate through the pages in the report by either clicking on the pages listed below, or by using the keyword search tool below to find specific information within the annual report.-
 1
1 -
2
-
3
-
4
-
5
-
6
-
7
-
8
-
9
-
10
-
11
-
12
-
13
-
14
-
15
-
16
-
17
-
18
-
19
-
20
-
21
-
22
-
23
-
24
-
25
-
26
-
27
-
28
-
29
-
30
-
31
-
32
-
33
-
34
-
35
-
36
-
37
-
38
-
39
-
40
-
41
-
42
-
43
-
44
-
45
-
46
-
47
-
48
-
49
-
50
-
51
-
52
-
53
-
54
-
55
-
56
-
57
-
58
-
59
-
60
-
61
-
62
-
 63
63 -
 64
64 -
 65
65 -
 66
66 -
 67
67 -
 68
68 -
 69
69 -
 70
70 -
 71
71 -
 72
72 -
 73
73 -
 74
74 -
 75
75 -
 76
76 -
 77
77 -
 78
78 -
 79
79 -
 80
80 -
 81
81 -
 82
82 -
 83
83 -
84
-
85
-
86
-
87
-
88
-
89
-
90
-
91
-
92
-
93
-
94
-
95
-
96
-
97
-
98
-
99
-
100
-
101
-
102
-
103
-
104
-
105
-
106
-
107
-
108
-
109
-
110
-
111
-
112
-
113
-
114
-
115
-
116
-
117
-
118
-
119
-
120
-
121
-
122
-
123
-
124
-
125
-
126
-
127
-
128
-
129
-
130
-
131
-
132
-
133
-
134
-
135
-
136
-
137
-
138
-
139
-
140
-
141
-
142
-
143
-
144
-
145
-
146
-
147
-
148
-
149
-
150
-
151
-
152
-
153
-
154
 |
 |

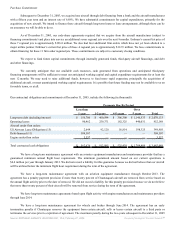
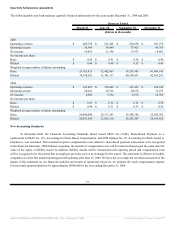
Quarterly Information (unaudited)
The following table sets forth summary quarterly financial information for the years ended December 31, 2004 and 2005.
Quarters Ended
March 31 June 30 September 30 December 31
(dollars in thousands)
2005
Operating revenues $ 209,759 $ 213,248 $ 230,238 $ 251,776
Operating income 36,540 34,969 37,425 49,785
Net income 14,825 13,396 13,971 18,462
Net income per share:
Basic $ 0.50 $ 0.41 $ 0.36 $ 0.44
Diluted $ 0.49 $ 0.40 $ 0.35 $ 0.43
Weighted average number of shares outstanding:
Basic 29,785,423 32,482,867 39,283,985 41,696,145
Diluted 30,538,283 33,341,317 40,149,831 42,916,233
2004
Operating revenues $ 141,885 $ 150,466 $ 165,453 $ 188,520
Operating income 20,641 18,762 20,670 31,272
Net income 8,280 7,234 8,572 14,766
Net income per share:
Basic $ 0.41 $ 0.32 $ 0.34 $ 0.58
Diluted $ 0.40 $ 0.31 $ 0.33 $ 0.56
Weighted average number of shares outstanding:
Basic 20,000,000 22,317,363 25,508,756 25,542,702
Diluted 20,887,240 23,055,110 26,203,207 26,164,628
New Accounting Standards
In December 2004, the Financial Accounting Standards Board issued SFAS No. 123(R), Share-Based Payment, as a
replacement of SFAS No. 123, Accounting for Stock-Based Compensation, and APB Opinion No. 25, Accounting for Stock Issued to
Employees, was rescinded. This statement requires compensation costs related to share-based payment transactions to be recognized
in the financial statements. With limited exceptions, the amount of compensation cost will be measured based upon the grant date fair
value of the equity or liability issued. In addition, liability awards will be remeasured each reporting period and compensation costs
will be recognized over the period that an employee provides service in exchange for the award. This statement is effective for public
companies as of the first annual reporting period beginning after June 15, 2005. We have not yet completed our final assessment of the
impact of this statement on our financial condition and results of operations. However, we estimate the stock compensation expense
for previously granted options to be approximately $900,000 for the year ending December 31, 2006.
-44-
Source: REPUBLIC AIRWAYS HOLDINGS INC, 10-K, February 27, 2006 Powered by Morningstar® Document Research℠