Frontier Airlines 2005 Annual Report Download - page 63
Download and view the complete annual report
Please find page 63 of the 2005 Frontier Airlines annual report below. You can navigate through the pages in the report by either clicking on the pages listed below, or by using the keyword search tool below to find specific information within the annual report.-
 1
1 -
2
-
3
-
4
-
5
-
6
-
7
-
8
-
9
-
10
-
11
-
12
-
13
-
14
-
15
-
16
-
17
-
18
-
19
-
20
-
21
-
22
-
23
-
24
-
25
-
26
-
27
-
28
-
29
-
30
-
31
-
32
-
33
-
34
-
35
-
36
-
37
-
38
-
39
-
40
-
41
-
42
-
43
-
44
-
45
-
46
-
47
-
48
-
49
-
50
-
51
-
52
-
 53
53 -
 54
54 -
 55
55 -
 56
56 -
 57
57 -
 58
58 -
 59
59 -
 60
60 -
 61
61 -
 62
62 -
 63
63 -
 64
64 -
 65
65 -
 66
66 -
 67
67 -
 68
68 -
 69
69 -
 70
70 -
 71
71 -
 72
72 -
 73
73 -
74
-
75
-
76
-
77
-
78
-
79
-
80
-
81
-
82
-
83
-
84
-
85
-
86
-
87
-
88
-
89
-
90
-
91
-
92
-
93
-
94
-
95
-
96
-
97
-
98
-
99
-
100
-
101
-
102
-
103
-
104
-
105
-
106
-
107
-
108
-
109
-
110
-
111
-
112
-
113
-
114
-
115
-
116
-
117
-
118
-
119
-
120
-
121
-
122
-
123
-
124
-
125
-
126
-
127
-
128
-
129
-
130
-
131
-
132
-
133
-
134
-
135
-
136
-
137
-
138
-
139
-
140
-
141
-
142
-
143
-
144
-
145
-
146
-
147
-
148
-
149
-
150
-
151
-
152
-
153
-
154
 |
 |

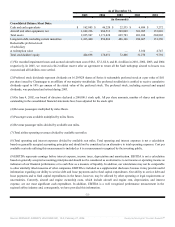
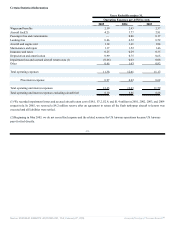
Results of Operations
2005 Compared to 2004
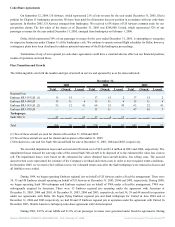
Operating revenue in 2005 increased by 40.0%, or $258.7 million, to $905.0 million compared to $646.3 million in 2004. The
increase was due to the 36 additional 70-seat regional jets added to revenue service in 2005 offset by the reduction of seven ERJ-145
regional jet aircraft that were removed from operations between September and November 2005. Five aircraft were removed from US
Airways and two were removed from United. Of these seven aircraft, five have been subleased to an airline in Mexico and two have
been placed into our charter operations. Seventeen regional jets were added for United, nine were added for Delta, and ten were added
for US Airways.
Total operating expenses increased by 34.5%, or $191.3 million, to $746.3 million in 2005 compared to $555.0 million in
2004 due to the increase in flight operations and the average price of fuel per gallon. Fuel is 100% reimbursed by our major airline
partners and recorded as revenue. Total operating and interest expenses increased by 38.8%, or $226.4 million, to $809.8 million for
2005 compared to $583.4 million during 2004. The cost per available seat mile on total operating and interest expenses, excluding fuel
charges, decreased to 8.1¢ in 2005 compared to 8.9¢ in 2004. Factors relating to the change in operating expenses are discussed
below.
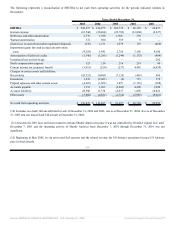
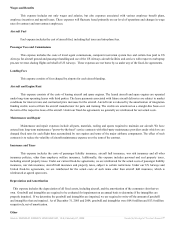
Wages and benefits increased by 28.1%, or $31.5 million, to $143.8 million for 2005 compared to $112.3 million for 2004
due to a 23% increase in full time equivalent employees to support the increased 70-seat regional jet operations combined with normal
wage increases. The cost per available seat mile decreased to 2.2¢ for 2005 compared to 2.4¢ in 2004.
Aircraft fuel expense increased 60.1%, or $104.7 million, to $278.9 million for 2005 compared to $174.2 million for 2004
due to a 43% increase in average fuel prices and a 12% increase in fuel consumption. Beginning in May 2005, we do not record fuel
expense and the related revenue for US Airways operations because US Airways pays for fuel directly. The average price per gallon
was $1.97 in 2005 and $1.38 in 2004. The unit cost increased to 4.3¢ in 2005 compared to 3.8¢ in 2004 due to the increase in average
fuel prices.
Passenger fees and commissions were $0 for 2005 compared to $2.9 million for 2004 due to the elimination of pro-rate
operations in September 2004. There are no passenger fees and commissions on any of the fixed-fee operations in 2005, including the
turboprops which ceased operations for United in November, 2005. The unit cost was 0.1¢ in 2004.
Landing fees increased by 25.5%, or $6.2 million, to $30.4 million in 2005 compared to $24.2 million in 2004. The increase
is due to a 17% increase in departures and a 12% increase in the average landing weight resulting from the increase in 70-seat
operations in 2005. Our fixed-fee agreements provide for a direct reimbursement of landing fees. The unit cost remained unchanged at
0.5¢.
Aircraft and engine rent increased by 4.3%, or $3.2 million, to $77.7 million in 2005 compared to $74.5 million in 2004 due
to the addition of five leased regional jets in 2005 and the full year effect of four regional jets leased in 2004. This increase was
partially offset by the termination of 13 leased Saab 340 turboprops. The unit cost decrease to 1.2¢ for 2005 compared to 1.6¢ for
2004 is attributable to the increase in capacity from the 70-seat regional jet operations and because we lease financed only five of the
36 aircraft added to the regional jet fleet in 2005.
Maintenance and repair expenses increased by 8.8%, or $6.2 million, to $76.5 million in 2005 compared to $70.3 million for
2004 due the increase in flying of the regional jets but partially offset by turboprop expenses that were approximately $10 million less
in 2005 than in 2004. The unit cost decreased to 1.2¢ in 2005 from 1.5¢ in 2004.
Insurance and taxes increased 22.2%, or $2.9 million, to $16.1 million in 2005 compared to $13.2 million in 2004. The
increase in operations and an increase in aircraft property taxes were partially offset by a decline in the average insurance rates year
over year. The unit cost remained unchanged at 0.3¢.
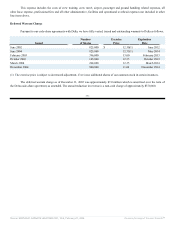
Depreciation and amortization increased 88.5%, or $30.5 million, to $64.9 million in 2005 compared to $34.4 million in 2004
due to depreciation on thirty-one 70-seat regional jet aircraft purchased in 2005 and the full year effect of 24 regional jet aircraft
Source: REPUBLIC AIRWAYS HOLDINGS INC, 10-K, February 27, 2006 Powered by Morningstar® Document Research℠