Frontier Airlines 2005 Annual Report Download - page 62
Download and view the complete annual report
Please find page 62 of the 2005 Frontier Airlines annual report below. You can navigate through the pages in the report by either clicking on the pages listed below, or by using the keyword search tool below to find specific information within the annual report.-
 1
1 -
2
-
3
-
4
-
5
-
6
-
7
-
8
-
9
-
10
-
11
-
12
-
13
-
14
-
15
-
16
-
17
-
18
-
19
-
20
-
21
-
22
-
23
-
24
-
25
-
26
-
27
-
28
-
29
-
30
-
31
-
32
-
33
-
34
-
35
-
36
-
37
-
38
-
39
-
40
-
41
-
42
-
43
-
44
-
45
-
46
-
47
-
48
-
49
-
50
-
51
-
 52
52 -
 53
53 -
 54
54 -
 55
55 -
 56
56 -
 57
57 -
 58
58 -
 59
59 -
 60
60 -
 61
61 -
 62
62 -
 63
63 -
 64
64 -
 65
65 -
 66
66 -
 67
67 -
 68
68 -
 69
69 -
 70
70 -
 71
71 -
 72
72 -
73
-
74
-
75
-
76
-
77
-
78
-
79
-
80
-
81
-
82
-
83
-
84
-
85
-
86
-
87
-
88
-
89
-
90
-
91
-
92
-
93
-
94
-
95
-
96
-
97
-
98
-
99
-
100
-
101
-
102
-
103
-
104
-
105
-
106
-
107
-
108
-
109
-
110
-
111
-
112
-
113
-
114
-
115
-
116
-
117
-
118
-
119
-
120
-
121
-
122
-
123
-
124
-
125
-
126
-
127
-
128
-
129
-
130
-
131
-
132
-
133
-
134
-
135
-
136
-
137
-
138
-
139
-
140
-
141
-
142
-
143
-
144
-
145
-
146
-
147
-
148
-
149
-
150
-
151
-
152
-
153
-
154
 |
 |

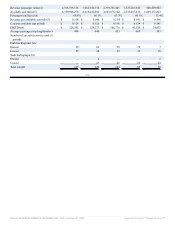
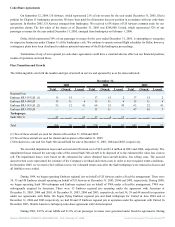
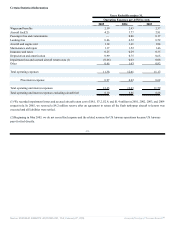
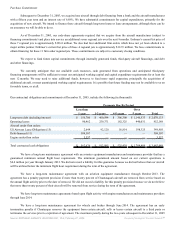
Years Ended December 31,
2005
Increase/
(Decrease)
2005-2004
2004
Increase/
(Decrease)
2004-2003
2003
Revenue passengers 9,137,132 33.5% 6,842,407 33.6% 5,120,987
Revenue passenger miles (1) 4,516,518,136 47.5% 3,062,940,174 32.1% 2,319,261,441
Available seat miles (2) 6,559,966,278 42.1% 4,618,042,586 26.0% 3,665,876,102
Passenger load factor (3) 68.8% 2.5 pp 66.3% 3.0pp 63.3%
Cost per available seat mile (4) 12.35¢ (2.2)% 12.63¢ 7.12% 11.79¢
Average price per gallon of fuel (5) $1.98 43.5% $1.38 25.5% $1.10
Fuel gallons consumed(6) 141,159,425 11.7% 126,344,270 30.4% 96,863,325
Block hours (7) 464,041 23.8% 374,749 27.0% 295,021
Average length of aircraft flight (miles) 487 10.7% 440 (0.5)% 442
Average daily utilization of each aircraft
(hours) (8) 10.50 2.2% 10.27 5.1% 9.77
Aircraft in service at end of period 142 10.9% 128 20.8% 106
(1) Revenue passenger miles are the number of scheduled miles flown by revenue passengers.
(2) Available seat miles are the number of seats available for passengers multiplied by the number of scheduled miles those seats are
flown.
(3) Revenue passenger miles divided by available seat miles.
(4) Total operating and interest expenses divided by available seat miles.
(5) Cost of aircraft fuel, including fuel taxes and into-plane fees.
(6) Beginning in May 2005, we do not record fuel expense and the related revenue for US Airways operations because US Airways
pays for fuel directly.
(7) Hours from takeoff to landing, including taxi time.
(8) Average number of hours per day that an aircraft flown in revenue service is operated (from gate departure to gate arrival).
-38-
Source: REPUBLIC AIRWAYS HOLDINGS INC, 10-K, February 27, 2006 Powered by Morningstar® Document Research℠