Foot Locker 2011 Annual Report Download - page 88
Download and view the complete annual report
Please find page 88 of the 2011 Foot Locker annual report below. You can navigate through the pages in the report by either clicking on the pages listed below, or by using the keyword search tool below to find specific information within the annual report.-
 1
1 -
2
-
3
-
4
-
5
-
6
-
7
-
8
-
9
-
10
-
11
-
12
-
13
-
14
-
15
-
16
-
17
-
18
-
19
-
20
-
21
-
22
-
23
-
24
-
25
-
26
-
27
-
28
-
29
-
30
-
31
-
32
-
33
-
34
-
35
-
36
-
37
-
38
-
39
-
40
-
41
-
42
-
43
-
44
-
45
-
46
-
47
-
48
-
49
-
50
-
51
-
52
-
53
-
54
-
55
-
56
-
57
-
58
-
59
-
60
-
61
-
62
-
63
-
64
-
65
-
66
-
67
-
68
-
69
-
70
-
71
-
72
-
73
-
74
-
75
-
76
-
77
-
 78
78 -
 79
79 -
 80
80 -
 81
81 -
 82
82 -
 83
83 -
 84
84 -
 85
85 -
 86
86 -
 87
87 -
 88
88 -
 89
89 -
 90
90 -
 91
91 -
 92
92 -
 93
93 -
 94
94 -
 95
95 -
 96
96 -
 97
97 -
 98
98 -
99
-
100
-
101
-
102
-
103
-
104
-
105
-
106
-
107
-
108
 |
 |

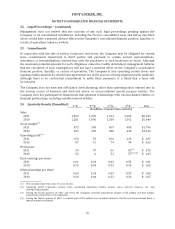
FOOT LOCKER, INC.
NOTES TO CONSOLIDATED FINANCIAL STATEMENTS
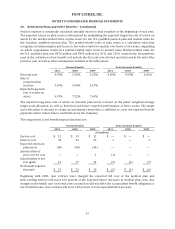
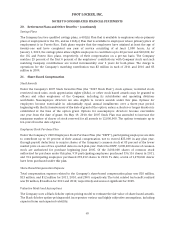
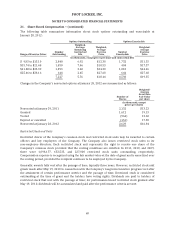
21. Share-Based Compensation − (continued)
The following table summarizes information about stock options outstanding and exercisable at
January 28, 2012:
Options Outstanding Options Exercisable
Range of Exercise Prices
Number
Outstanding
Weighted-
Average
Remaining
Contractual
Life
Weighted-
Average
Exercise
Price
Number
Exercisable
Weighted-
Average
Exercise
Price
(in thousands, except prices per share and contractual life)
$ 9.85 to $15.10 2,840 6.92 $12.38 1,732 $11.55
$15.74 to $21.48 1,850 7.46 $18.53 404 $17.37
$21.80 to $25.39 1,893 3.48 $24.28 1,818 $24.26
$25.46 to $28.16 644 2.45 $27.68 644 $27.68
7,227 5.76 $18.44 4,598 $19.35
Changes in the Company’s nonvested options at January 28, 2012 are summarized as follows:
Number of
Shares
Weighted-
Average
Grant Date
Fair Value
per share
(in thousands, except
prices per share)
Nonvested at January 29, 2011 2,132 $13.23
Granted 1,612 19.13
Vested (964) 12.60
Expired or cancelled (151) 17.38
Nonvested at January 28, 2012 2,629 $16.84
Restricted Stock and Units
Restricted shares of the Company’s common stock and restricted stock units may be awarded to certain
officers and key employees of the Company. The Company also issues restricted stock units to its
non-employee directors. Each restricted stock unit represents the right to receive one share of the
Company’s common stock provided that the vesting conditions are satisfied. In 2011, 2010, and 2009,
there were 1,098,177, 653,535, and 227,000 restricted stock units outstanding, respectively.
Compensation expense is recognized using the fair market value at the date of grant and is amortized over
the vesting period, provided the recipient continues to be employed by the Company.
Generally, awards fully vest after the passage of time, typically three years. However, restricted stock unit
grants made after May 19, 2010 in connection with the Company’s long-term incentive program vest after
the attainment of certain performance metrics and the passage of time. Restricted stock is considered
outstanding at the time of grant and the holders have voting rights. Dividends are paid to holders of
restricted stock that vest with the passage of time; for performance-based restricted stock granted after
May 19, 2010, dividends will be accumulated and paid after the performance criteria are met.
68