Foot Locker 2011 Annual Report Download - page 32
Download and view the complete annual report
Please find page 32 of the 2011 Foot Locker annual report below. You can navigate through the pages in the report by either clicking on the pages listed below, or by using the keyword search tool below to find specific information within the annual report.-
 1
1 -
2
-
3
-
4
-
5
-
6
-
7
-
8
-
9
-
10
-
11
-
12
-
13
-
14
-
15
-
16
-
17
-
18
-
19
-
20
-
21
-
 22
22 -
 23
23 -
 24
24 -
 25
25 -
 26
26 -
 27
27 -
 28
28 -
 29
29 -
 30
30 -
 31
31 -
 32
32 -
 33
33 -
 34
34 -
 35
35 -
 36
36 -
 37
37 -
 38
38 -
 39
39 -
 40
40 -
 41
41 -
 42
42 -
43
-
44
-
45
-
46
-
47
-
48
-
49
-
50
-
51
-
52
-
53
-
54
-
55
-
56
-
57
-
58
-
59
-
60
-
61
-
62
-
63
-
64
-
65
-
66
-
67
-
68
-
69
-
70
-
71
-
72
-
73
-
74
-
75
-
76
-
77
-
78
-
79
-
80
-
81
-
82
-
83
-
84
-
85
-
86
-
87
-
88
-
89
-
90
-
91
-
92
-
93
-
94
-
95
-
96
-
97
-
98
-
99
-
100
-
101
-
102
-
103
-
104
-
105
-
106
-
107
-
108
 |
 |

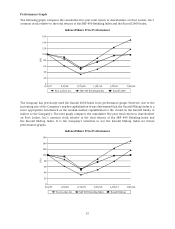
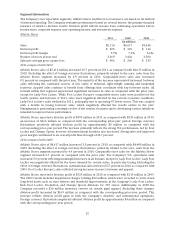
Performance Graph
The following graph compares the cumulative five-year total return to shareholders on Foot Locker, Inc.’s
common stock relative to the total returns of the S&P 400 Retailing Index and the Russell 2000 Index.
Indexed Share Price Performance
0
20
40
60
80
100
120
140
160
2/3/07 2/2/08 1/31/09 1/30/10 1/29/11 1/28/12
Foot Locker, Inc. S&P 400 Retailing Index Russell 2000
(%)
The Company has previously used the Russell 2000 Index in its performance graph. However, due to the
increasing size of the Company’s market capitalization it was determined that the Russell Midcap Index is a
more appropriate benchmark as the median market capitalization is the closest in the Russell family of
indices to the Company’s. The next graph compares the cumulative five-year total return to shareholders
on Foot Locker, Inc.’s common stock relative to the total returns of the S&P 400 Retailing Index and
the Russell Midcap Index. It is the Company’s intention to use the Russell Midcap Index for future
performance graphs.
Indexed Share Price Performance
0
20
40
60
80
100
120
140
160
2/3/07 2/2/08 1/31/09 1/30/10 1/29/11 1/28/12
(%)
Foot Locker, Inc. S&P 400 Retailing Index Russell Midcap
12