Foot Locker 2011 Annual Report Download - page 42
Download and view the complete annual report
Please find page 42 of the 2011 Foot Locker annual report below. You can navigate through the pages in the report by either clicking on the pages listed below, or by using the keyword search tool below to find specific information within the annual report.-
 1
1 -
2
-
3
-
4
-
5
-
6
-
7
-
8
-
9
-
10
-
11
-
12
-
13
-
14
-
15
-
16
-
17
-
18
-
19
-
20
-
21
-
22
-
23
-
24
-
25
-
26
-
27
-
28
-
29
-
30
-
31
-
 32
32 -
 33
33 -
 34
34 -
 35
35 -
 36
36 -
 37
37 -
 38
38 -
 39
39 -
 40
40 -
 41
41 -
 42
42 -
 43
43 -
 44
44 -
 45
45 -
 46
46 -
 47
47 -
 48
48 -
 49
49 -
 50
50 -
 51
51 -
 52
52 -
53
-
54
-
55
-
56
-
57
-
58
-
59
-
60
-
61
-
62
-
63
-
64
-
65
-
66
-
67
-
68
-
69
-
70
-
71
-
72
-
73
-
74
-
75
-
76
-
77
-
78
-
79
-
80
-
81
-
82
-
83
-
84
-
85
-
86
-
87
-
88
-
89
-
90
-
91
-
92
-
93
-
94
-
95
-
96
-
97
-
98
-
99
-
100
-
101
-
102
-
103
-
104
-
105
-
106
-
107
-
108
 |
 |

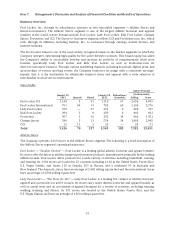
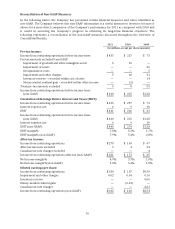
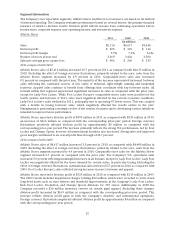
Segment Information
The Company’s two reportable segments, Athletic Stores and Direct-to-Customers, are based on its method
of internal reporting. The Company evaluates performance based on several factors, the primary financial
measure of which is division results. Division profit reflects income from continuing operations before
income taxes, corporate expense, non-operating income, and net interest expense.
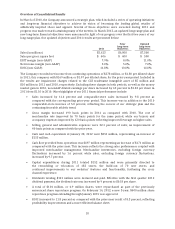
Athletic Stores
2011 2010 2009
(in millions)
Sales $5,110 $4,617 $4,448
Division profit $ 495 $ 329 $ 114
Division profit margin 9.7% 7.1% 2.6%
Number of stores at year end 3,369 3,426 3,500
Sales per average gross square foot $ 406 $ 360 $ 333
2011 compared with 2010
Athletic Stores sales of $5,110 million increased 10.7 percent in 2011, as compared with $4,617 million in
2010. Excluding the effect of foreign currency fluctuations, primarily related to the euro, sales from the
Athletic Stores segment increased by 8.9 percent in 2011. Comparable-store sales also increased
8.9 percent as compared with the prior year. The majority of the increase represented increased footwear
sales reflecting the continued success of key styles of technical, light-weight running and basketball
footwear. Apparel sales continue to benefit from offerings that coordinate with key footwear styles. All
formats within this segment experienced significant increases in sales as compared with the prior year,
except for Lady Foot Locker. While Foot Locker Europe’s comparable-stores sales were positive for the
fourth quarter and full-year of 2011, sales were negatively affected by the current economic conditions.
Lady Foot Locker’s sales declined in 2011, principally due to operating 47 fewer stores. This was coupled
with a decline in toning footwear sales, which negatively affected the results earlier in the year.
Management is performing a strategic review of the women’s business and is developing various initiatives
intended to improve future performance.
Athletic Stores reported a division profit of $495 million in 2011 as compared with $329 million in 2010,
an increase of $166 million as compared with the corresponding prior-year period. Foreign currency
fluctuations positively affected division profit by approximately $8 million as compared with the
corresponding prior-year period. The increase primarily reflects the strong U.S. performance, led by Foot
Locker and Champs Sports, however all international locations also increased. Strong sales and improved
gross margin contributed to an overall profit flow-through of 33.7 percent.
2010 compared with 2009
Athletic Stores sales of $4,617 million increased 3.8 percent in 2010, as compared with $4,448 million in
2009. Excluding the effect of foreign currency fluctuations, primarily related to the euro, sales from the
Athletic Stores segment increased by 4.4 percent in 2010. Comparable-store sales for the Athletic Stores
segment increased 5.7 percent as compared with the prior year. The Company’s U.S. operations sales
increased 3.9 percent reflecting meaningful increases in all formats, except for Lady Foot Locker. Lady Foot
Locker was negatively affected by the lower demand for certain styles, in particular toning. Excluding the
effect of foreign currency fluctuations, international sales increased 5.5 percent in 2010 as compared with
2009. Foot Locker Europe’s sales reflected strong increases in men’s footwear and apparel.
Athletic Stores reported a division profit of $329 million in 2010 as compared with $114 million in 2009.
The 2009 results included impairment charges totaling $32 million, which were recorded to write down
long-lived assets such as store fixtures and leasehold improvements, at the Company’s Lady Foot Locker,
Kids Foot Locker, Footaction, and Champs Sports divisions for 787 stores. Additionally, in 2009 the
Company recorded a $14 million inventory reserve on certain aged apparel. Excluding these charges,
division profit increased by $169 million as compared with the corresponding prior-year period. This
increase reflects division profit gains in both the Company’s domestic and international operations.
Foreign currency fluctuations negatively affected division profit by approximately $4 million as compared
with the corresponding prior-year period.
22